Fig. 1
Download original image
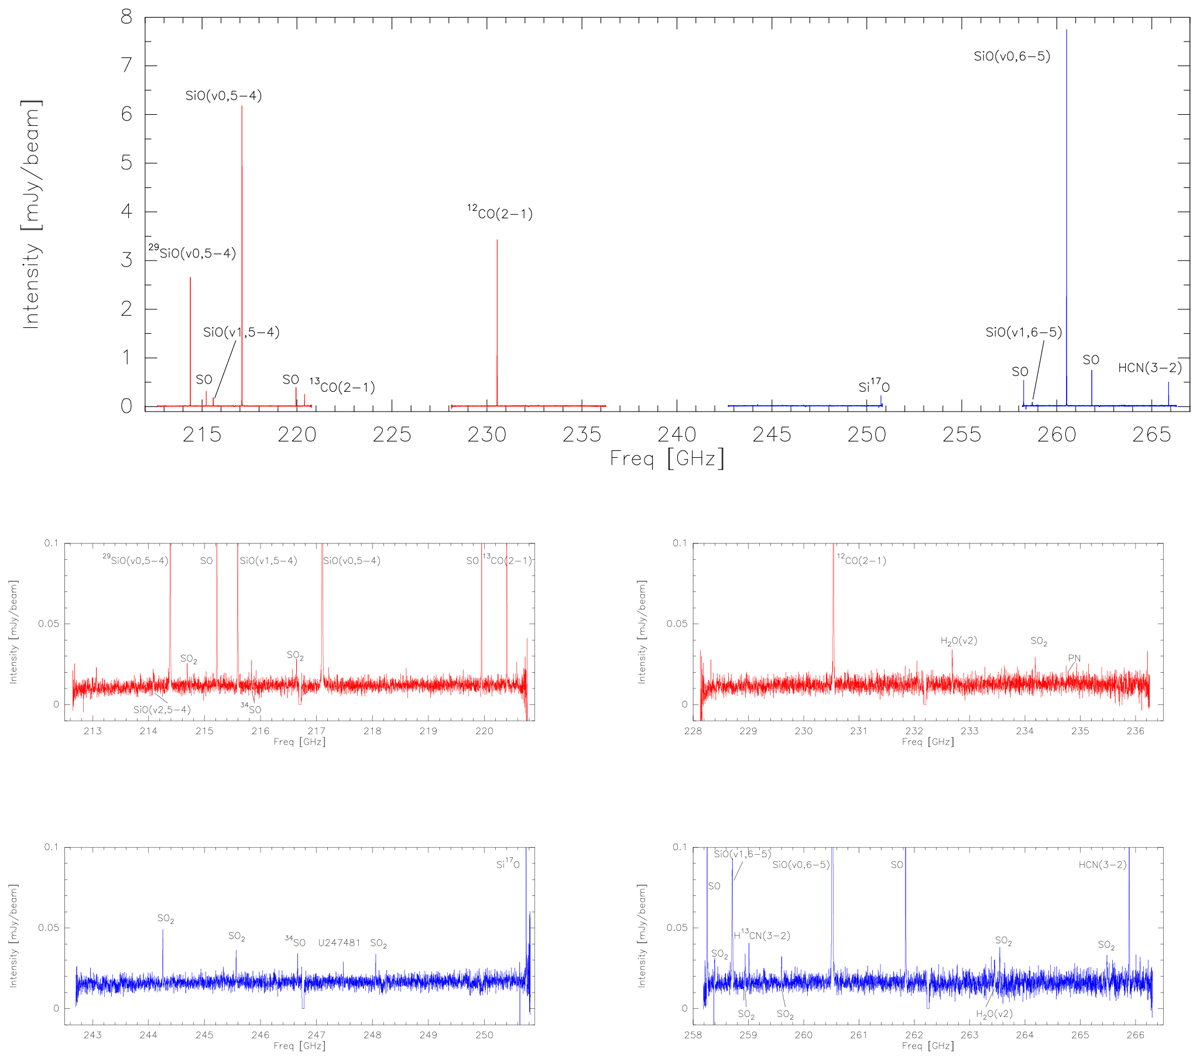
Overview of the frequency ranges observed with PolyFiX using two spectral setups (setup1: red and setup2: blue, respectively). Lower diagrams: zoom onto the individual spectra covering 7.8 GHz each. Upper row: setup1, lower row: setup2. Thecentral 20 MHz at the border between inner and outer baseband are blanked out, i.e., set to zero, as this region is contaminated by the LO2 separation of the 8 GHz-wide IF in the IF processor (“LO2 zone”).
Current usage metrics show cumulative count of Article Views (full-text article views including HTML views, PDF and ePub downloads, according to the available data) and Abstracts Views on Vision4Press platform.
Data correspond to usage on the plateform after 2015. The current usage metrics is available 48-96 hours after online publication and is updated daily on week days.
Initial download of the metrics may take a while.