Fig. 9.
Download original image
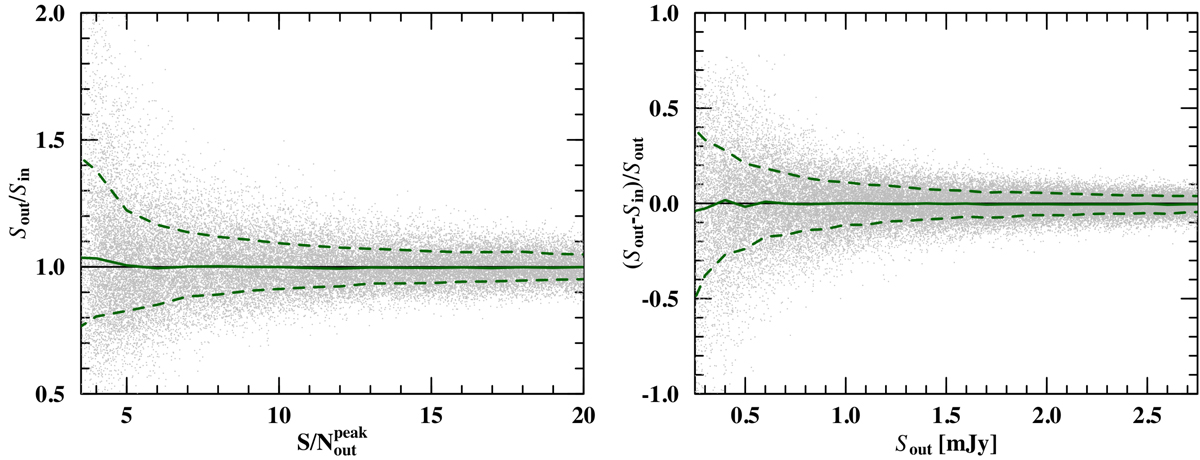
Ratio of the output over input flux densities (Sout/Sin) as a function of the output detection S/Npeak (![]() ) from PyBDSF, measured as the peak flux density over the local rms noise (left panel), and flux density accuracy ((Sout − Sin)/Sout) as a function of the output flux density (Sout) measured with the aperture photometry methodology (right panel) for simulated sources with sizes ranging
) from PyBDSF, measured as the peak flux density over the local rms noise (left panel), and flux density accuracy ((Sout − Sin)/Sout) as a function of the output flux density (Sout) measured with the aperture photometry methodology (right panel) for simulated sources with sizes ranging ![]() FWHM. The distribution of the whole set of simulations is shown as gray symbols with their sliding median and standard deviation in solid and dashed green, respectively.
FWHM. The distribution of the whole set of simulations is shown as gray symbols with their sliding median and standard deviation in solid and dashed green, respectively.
Current usage metrics show cumulative count of Article Views (full-text article views including HTML views, PDF and ePub downloads, according to the available data) and Abstracts Views on Vision4Press platform.
Data correspond to usage on the plateform after 2015. The current usage metrics is available 48-96 hours after online publication and is updated daily on week days.
Initial download of the metrics may take a while.