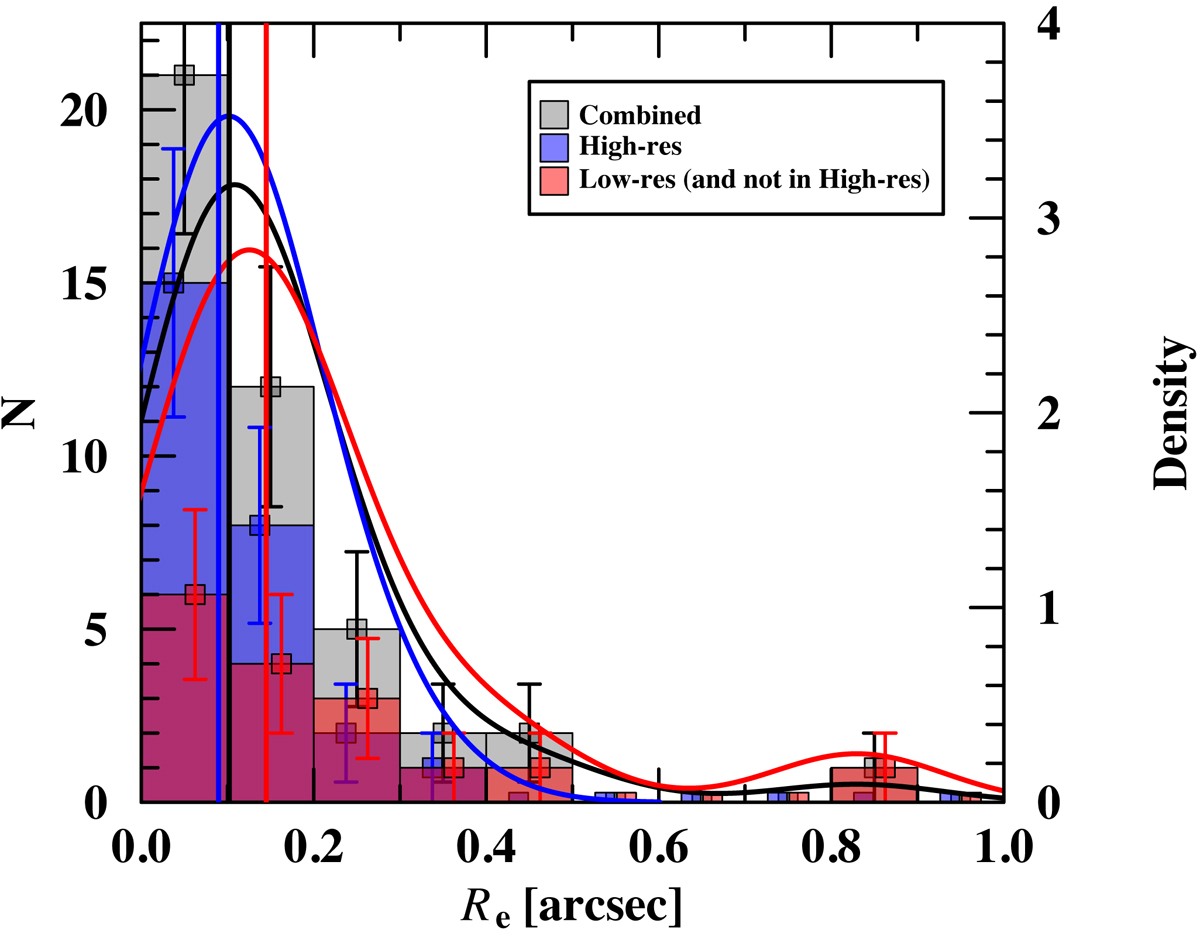
Fig. 6.
Download original image
Size distribution of the 100% pure main catalog detected in the combined dataset (gray). We show histograms with Poisson error bars and probability density curves (kernel density estimates, by definition normalized to an area under the curve equal to one). Medians are displayed as a solid vertical line. The sizes were measured as the effective radius of the circular Gaussian model fit in the uv plane. Sources detected in the high resolution dataset are shown in blue, while sources also present in the low resolution dataset but not in the high resolution dataset, are shown in red. We note that the black, blue, and red histograms are overlaid, not stacked. The histogram bins are such that all the upper limits fall in the first bin to keep a correct shape.
Current usage metrics show cumulative count of Article Views (full-text article views including HTML views, PDF and ePub downloads, according to the available data) and Abstracts Views on Vision4Press platform.
Data correspond to usage on the plateform after 2015. The current usage metrics is available 48-96 hours after online publication and is updated daily on week days.
Initial download of the metrics may take a while.