Fig. 5.
Download original image
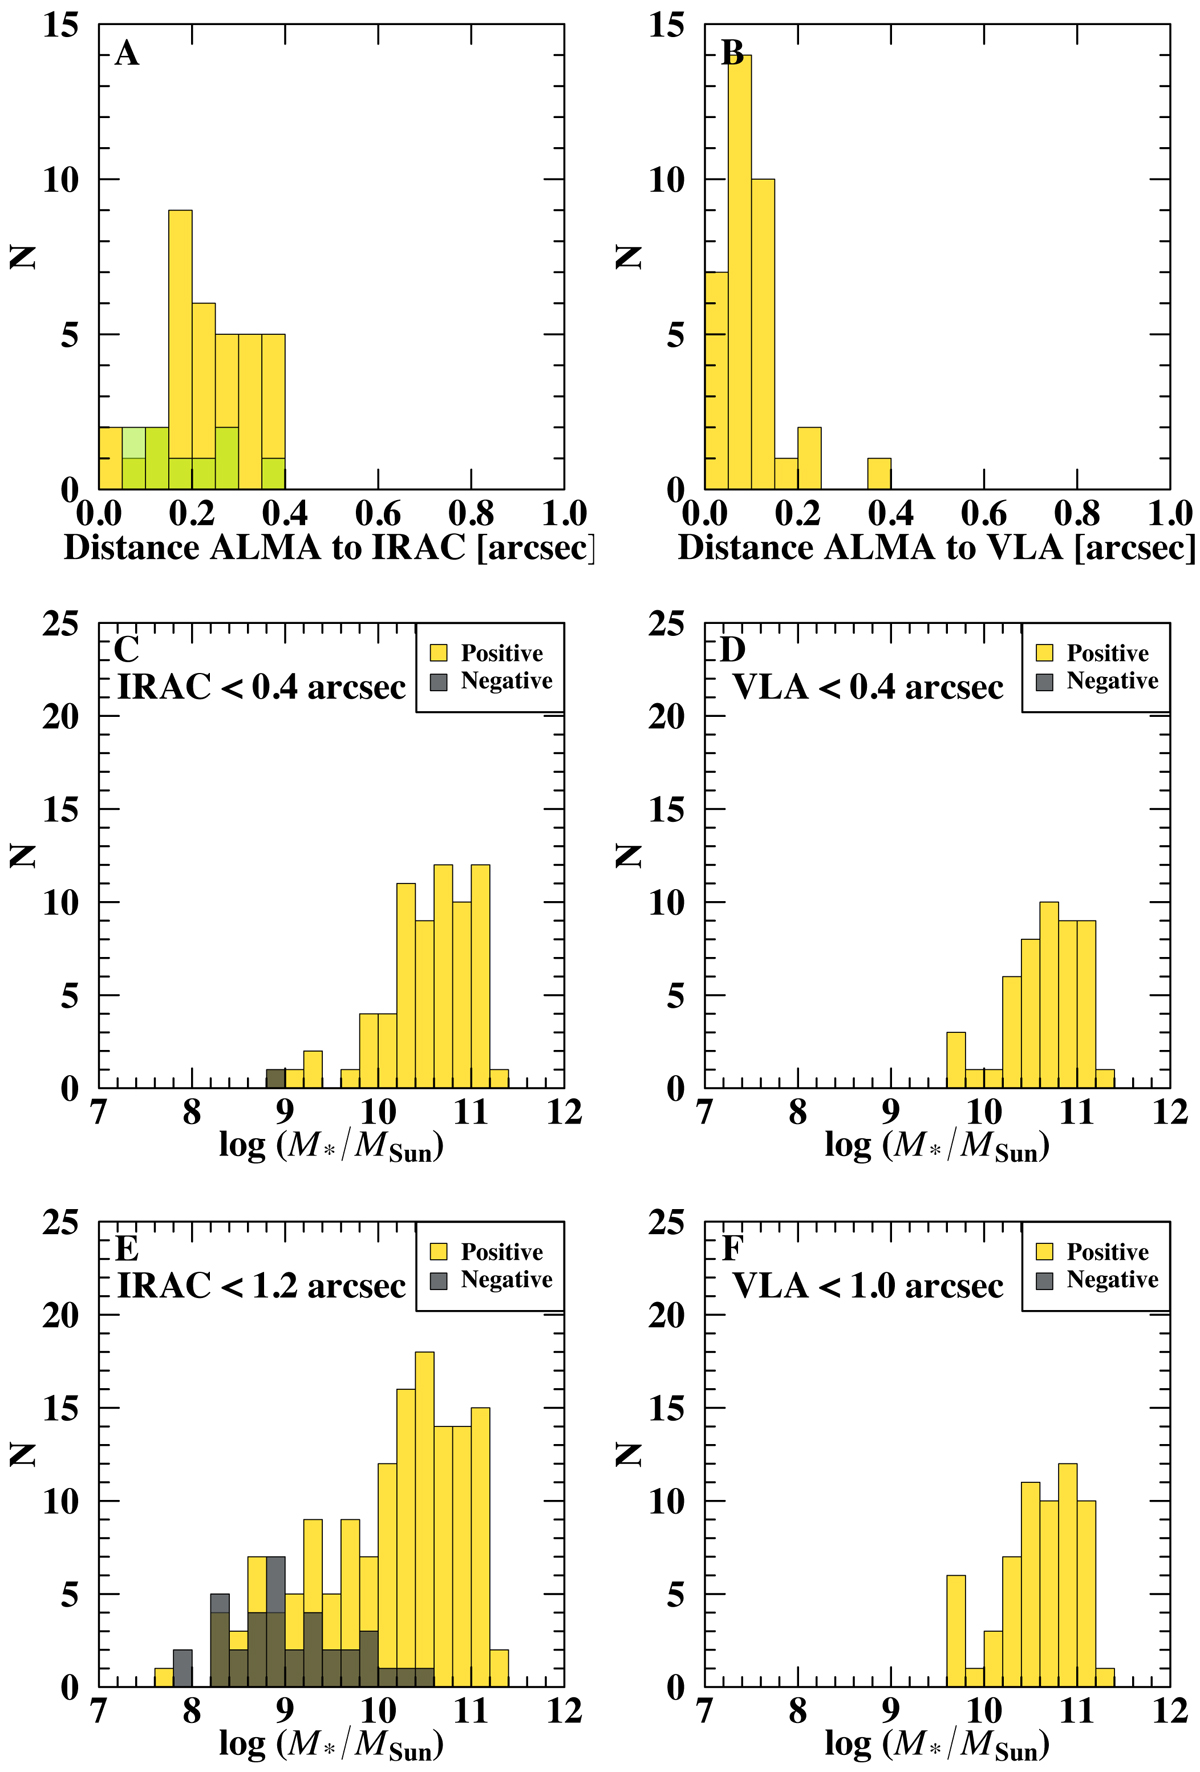
Panels A and B: distance from the ALMA sources in the 100% pure main catalog to the closest IRAC counterpart in Ashby et al. (2015) (panel A) and VLA counterpart at 3 GHz (Rujopakarn et al., in prep.) (panel B). Panel A: sources whose coordinates were corrected accounting for blending in IRAC are highlighted in green (see main text). Panels C, D, E, and F: number of positive (yellow histogram) and negative (black histogram) detections in the σp = 3.0 blind detection in the combined dataset map with an IRAC counterpart at ![]() (panel C) and
(panel C) and ![]() (panel E) or with a VLA counterpart at
(panel E) or with a VLA counterpart at ![]() (panel D) and
(panel D) and ![]() (panel F) as a function of stellar mass.
(panel F) as a function of stellar mass.
Current usage metrics show cumulative count of Article Views (full-text article views including HTML views, PDF and ePub downloads, according to the available data) and Abstracts Views on Vision4Press platform.
Data correspond to usage on the plateform after 2015. The current usage metrics is available 48-96 hours after online publication and is updated daily on week days.
Initial download of the metrics may take a while.