Fig. 4.
Download original image
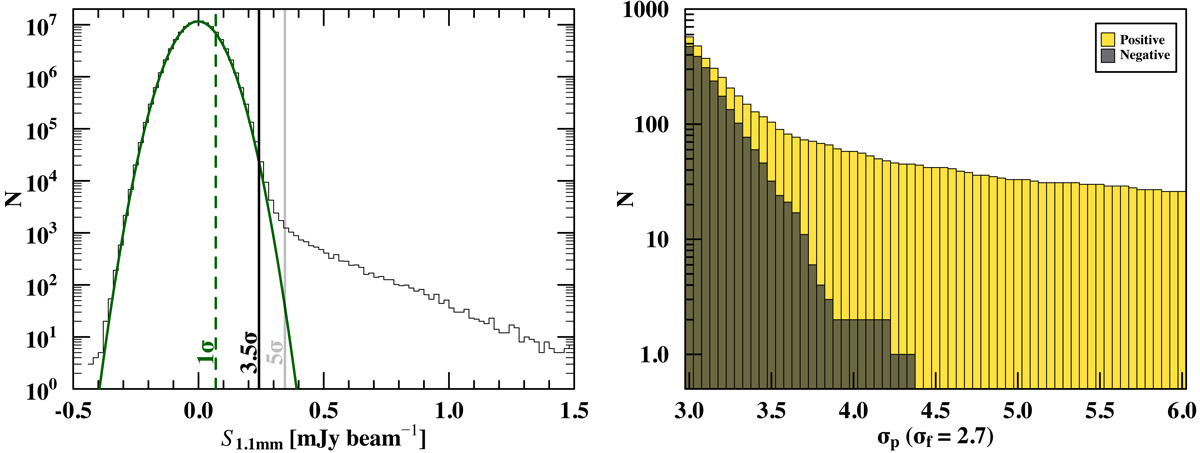
Left panel: pixel distribution in the combined dataset map. The solid green curve shows the result of a Gaussian fit and indicates the noise level (σ = 68.4 μJy beam−1). Right panel: number of positive (yellow histogram) and negative (black histogram) detections as a function of the pixel threshold σp for a fixed island threshold σf = 2.7 in the combined dataset map. We note that the number of detections is a differential value and not cumulative with decreasing σp.
Current usage metrics show cumulative count of Article Views (full-text article views including HTML views, PDF and ePub downloads, according to the available data) and Abstracts Views on Vision4Press platform.
Data correspond to usage on the plateform after 2015. The current usage metrics is available 48-96 hours after online publication and is updated daily on week days.
Initial download of the metrics may take a while.