Fig. 15.
Download original image
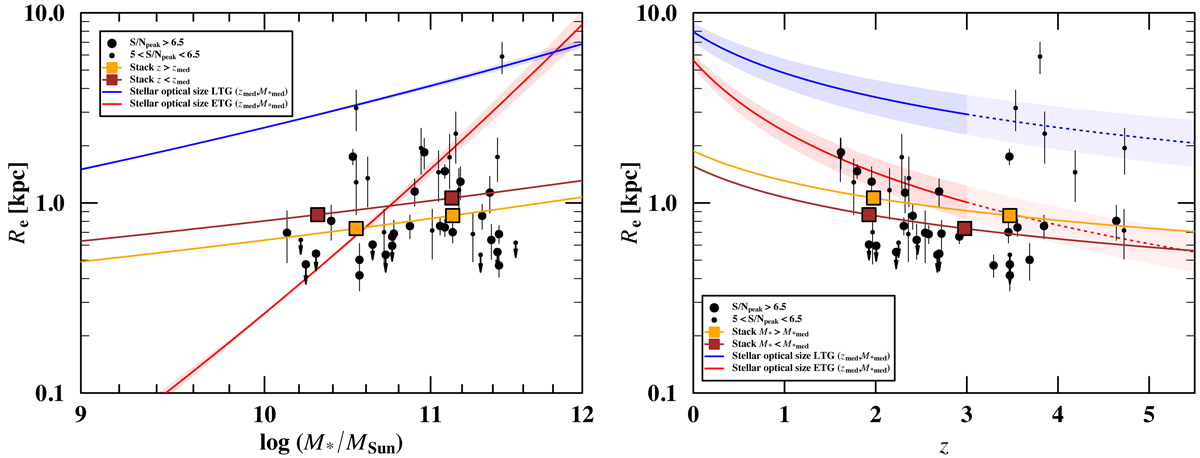
Re − M* (left panel) and Re − z (right panel) planes. Dust continuum sizes at 1.1 mm as measured for stacks of sources in bins of redshift and stellar mass and the associated fits shown in Tables 6 and 7 are displayed. The dust continuum sizes measured for individual sources in the 100% pure main catalog are also shown distinguishing sources with a detection S/Npeak > 6.5 (big black circles, representing approximately the top third of the source catalog) and sources with a detection 5 < S/Npeak < 6.5 (small black circles). For comparison, the stellar size measured at optical wavelengths evolution with redshift and stellar mass for both early and late-type galaxies from van der Wel et al. (2014) at the median values of the source catalog (zmed = 2.46 and log(M*med/M⊙)=10.79) are also shown with their scatter displayed as a shaded areas (at z > 3 extrapolations of the van der Wel et al. 2014 evolutionary trends are shown as dotted lines).
Current usage metrics show cumulative count of Article Views (full-text article views including HTML views, PDF and ePub downloads, according to the available data) and Abstracts Views on Vision4Press platform.
Data correspond to usage on the plateform after 2015. The current usage metrics is available 48-96 hours after online publication and is updated daily on week days.
Initial download of the metrics may take a while.