Fig. 14.
Download original image
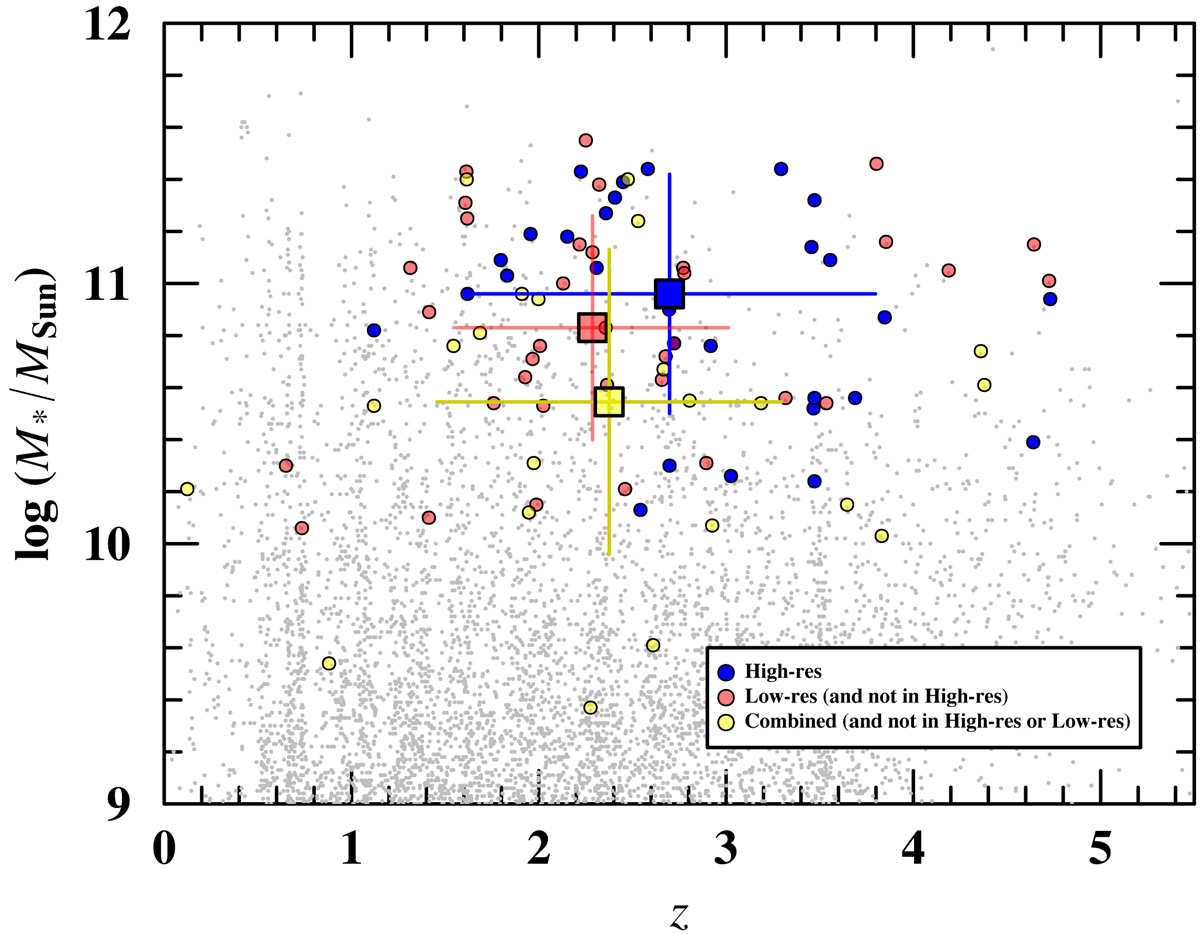
Stellar mass versus redshift for the sources in the 100% pure plus prior-based catalogs from the combined dataset, distinguishing between sources that appear in the high resolution dataset (blue), in the low resolution but not in the high resolution dataset (red), and in the combined but not in the high resolution or low resolution datasets (yellow). Medians are shown as big squares, where the uncertainties are given by the median absolute deviation.
Current usage metrics show cumulative count of Article Views (full-text article views including HTML views, PDF and ePub downloads, according to the available data) and Abstracts Views on Vision4Press platform.
Data correspond to usage on the plateform after 2015. The current usage metrics is available 48-96 hours after online publication and is updated daily on week days.
Initial download of the metrics may take a while.