Fig. 13.
Download original image
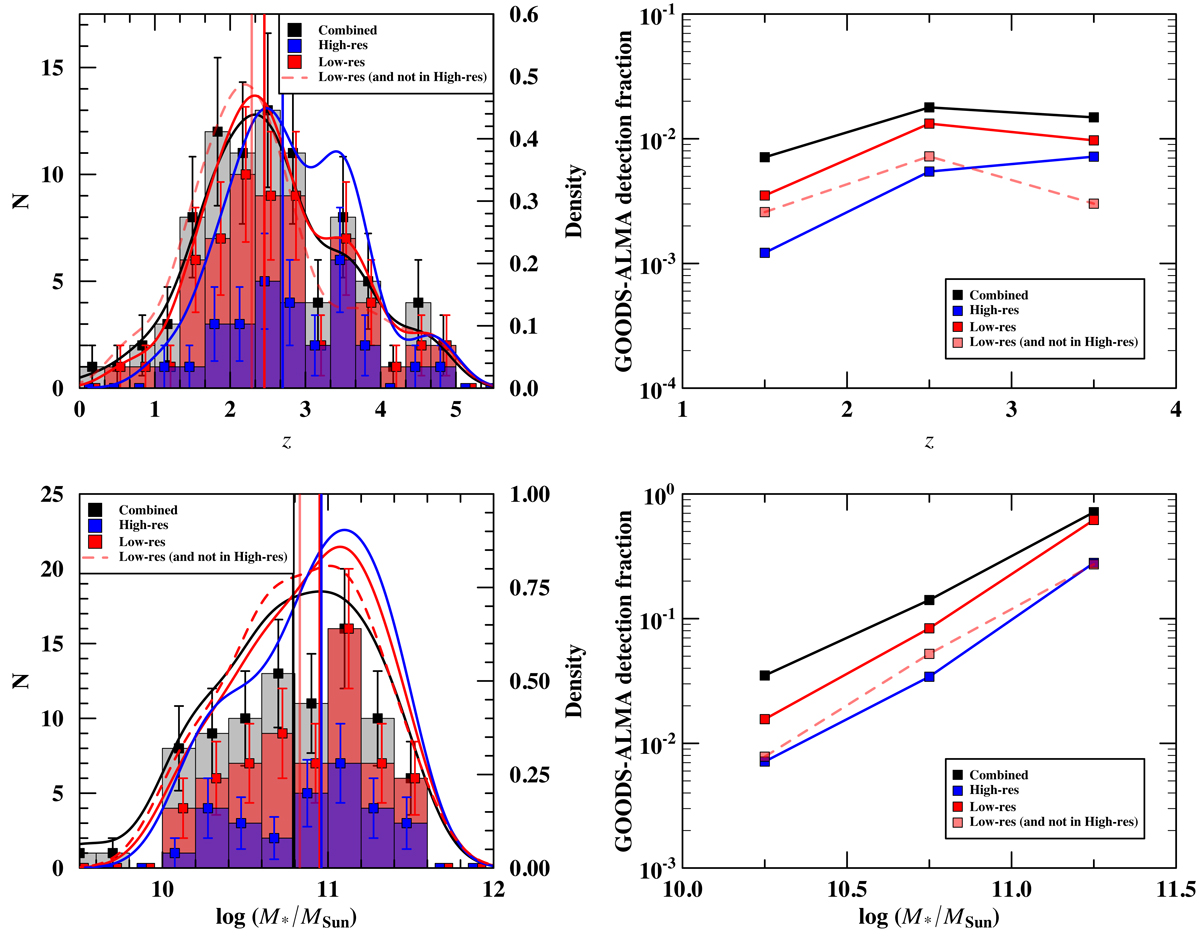
Top left panel: redshift distribution. We show histograms with Poisson error bars and probability density curves (kernel density estimates, by definition normalized to an area under the curve equal to one). We note that the histograms are overlaid, not stacked. Medians are displayed as a solid vertical line. The distribution was constructed using the values in Tables 2 and 3, which represent the best redshift estimate for each source from a spectroscopic or photometric origin. Top right panel: detection fraction of sources in GOODS-ALMA 2.0 compared to all the galaxies in ZFOURGE located within the same area as a function of redshift for galaxies with stellar masses 10.0 < log(M*/M⊙)< 11.5. Bottom left panel: similar to the top left panel but in terms of the stellar mass. Bottom right panel: similar to the top right panel but in terms of the stellar mass for galaxies with redshift 1 < z < 4. In all panels, we represent the whole 100% pure plus prior-based catalogs from the combined dataset (black), the sources detected in the high resolution (blue) and low resolution (red) datasets, along with the sources that appear in the low resolution but do not in the high resolution dataset (dashed red). We note that for simplicity, in the case of the sources that appear in the low resolution but do not in the high resolution dataset the histograms are omitted and only the probability density curves are displayed.
Current usage metrics show cumulative count of Article Views (full-text article views including HTML views, PDF and ePub downloads, according to the available data) and Abstracts Views on Vision4Press platform.
Data correspond to usage on the plateform after 2015. The current usage metrics is available 48-96 hours after online publication and is updated daily on week days.
Initial download of the metrics may take a while.