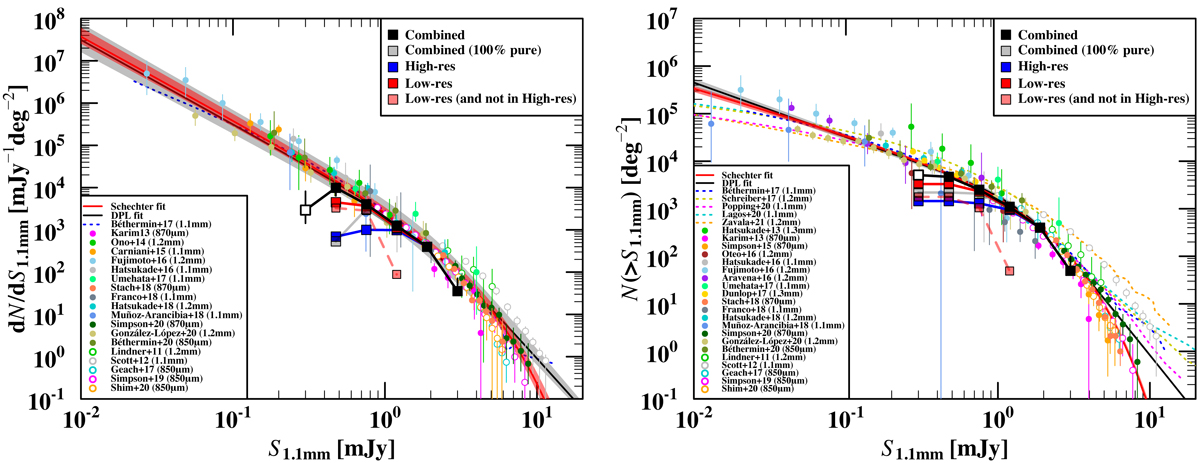
Fig. 11.
Download original image
Differential (left panel) and cumulative (right panel) number counts from the combined dataset using the 100% pure plus prior-based catalogs (black symbols). The first bin (white symbol) is not used in our analysis. Also displayed the contribution of the 100% pure catalog only (gray symbols), the sources extracted in the high resolution (blue symbols) and low resolution (red symbols) datasets. In both panels we display literature studies of ALMA number counts at similar wavelengths of 1.3, 1.2, 1.1 mm, 870 μm, and 850 μm (filled circles) converted to 1.1 mm as explained in the main text. We also add some other single-dish literature studies (open circles). Best-fit Schechter and DPL functions using the entire set of number counts from all the ALMA studies are shown in red and black solid lines, respectively, with their uncertainties corresponding to the 16% and 84% percentiles as a shaded area. Predicted number counts from several models in the literature are shown with dotted lines.
Current usage metrics show cumulative count of Article Views (full-text article views including HTML views, PDF and ePub downloads, according to the available data) and Abstracts Views on Vision4Press platform.
Data correspond to usage on the plateform after 2015. The current usage metrics is available 48-96 hours after online publication and is updated daily on week days.
Initial download of the metrics may take a while.