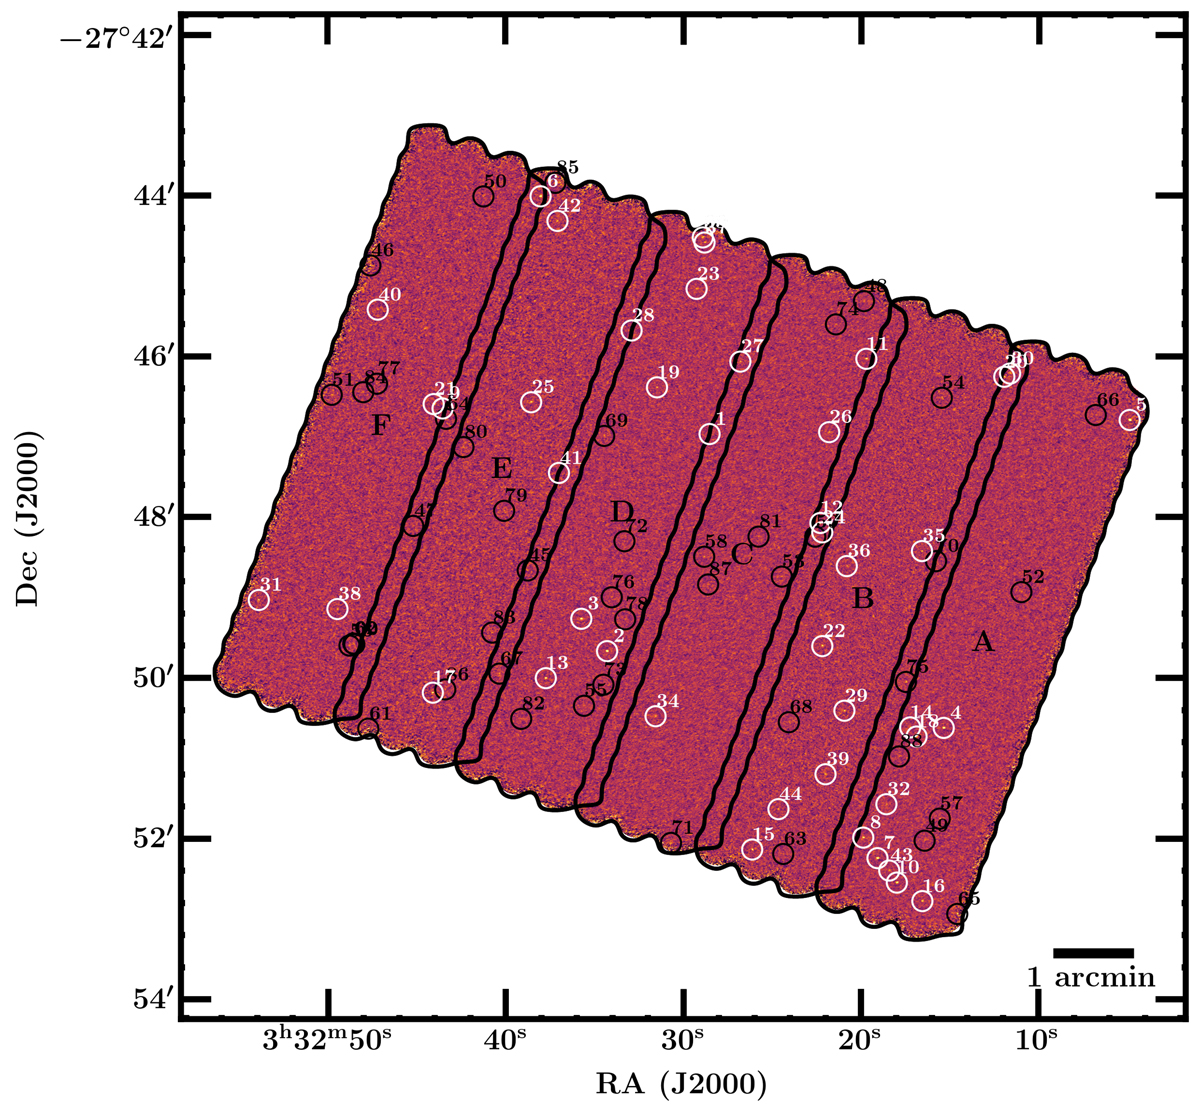
Fig. 1.
Download original image
GOODS-ALMA 2.0 map at 1.1 mm constructed by the combination of the high resolution and low resolution datasets (combined dataset). The sources detected with a purity of 100% as explained in Sect. 3.1.1 are marked with white circles and the sources detected using priors as described in Sect. 3.1.2 are marked with black circles. North is up, east is to the left. Cutouts of each source are shown in Appendix A.
Current usage metrics show cumulative count of Article Views (full-text article views including HTML views, PDF and ePub downloads, according to the available data) and Abstracts Views on Vision4Press platform.
Data correspond to usage on the plateform after 2015. The current usage metrics is available 48-96 hours after online publication and is updated daily on week days.
Initial download of the metrics may take a while.