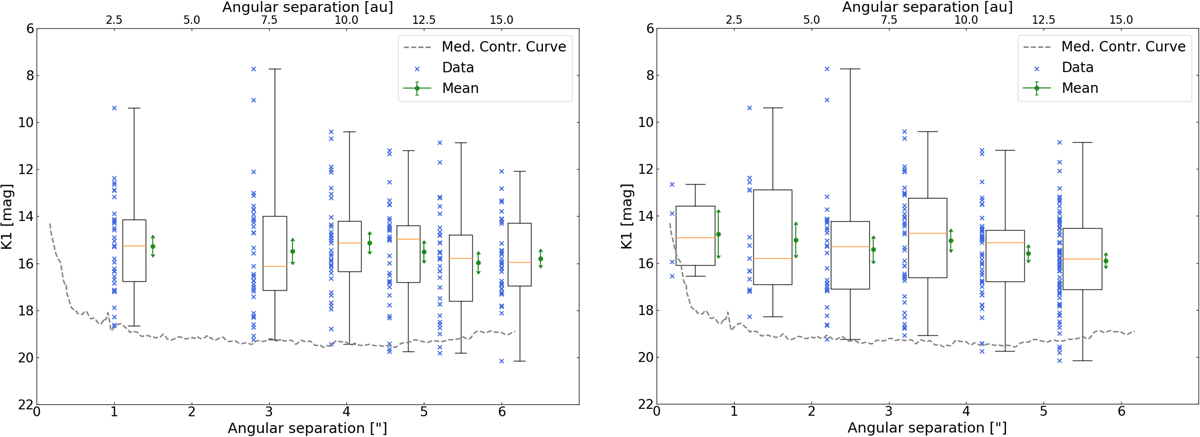
Fig. 9.
Download original image
Box plots of the distribution of K1 magnitudes of detected sources as a function of radial distance from the central stars. Boxes mark the range between the 0.25 and 0.75 percentiles, with orange lines indicating the median magnitude for each bin. The mean and its 1σ-uncertainty is provided to the right-hand side of each box (green dot and arrows), while the K-mag distribution of the stars in each bin is indicated to the left-hand side of each box (blue crosses). The extent of the sample is provided by the vertical bars. The dashed line provides the IRDIS median contrast curve. The 211 sources were divided into six bins, but the choice of the bins differ in each panel. Left panel: each bin has an equal amount of sources, with 35 sources per bin. Right panel: the IRDIS FoV was divided into equally sized bins. The former plot alleviates the expected r2 dependence of the effective surface of equally spaced bins (hence of the expected number of sources) as well as bin-to-bin variations due to difference sample sizes. The latter plot allows us to go closer to the central star.
Current usage metrics show cumulative count of Article Views (full-text article views including HTML views, PDF and ePub downloads, according to the available data) and Abstracts Views on Vision4Press platform.
Data correspond to usage on the plateform after 2015. The current usage metrics is available 48-96 hours after online publication and is updated daily on week days.
Initial download of the metrics may take a while.