Fig. 8.
Download original image
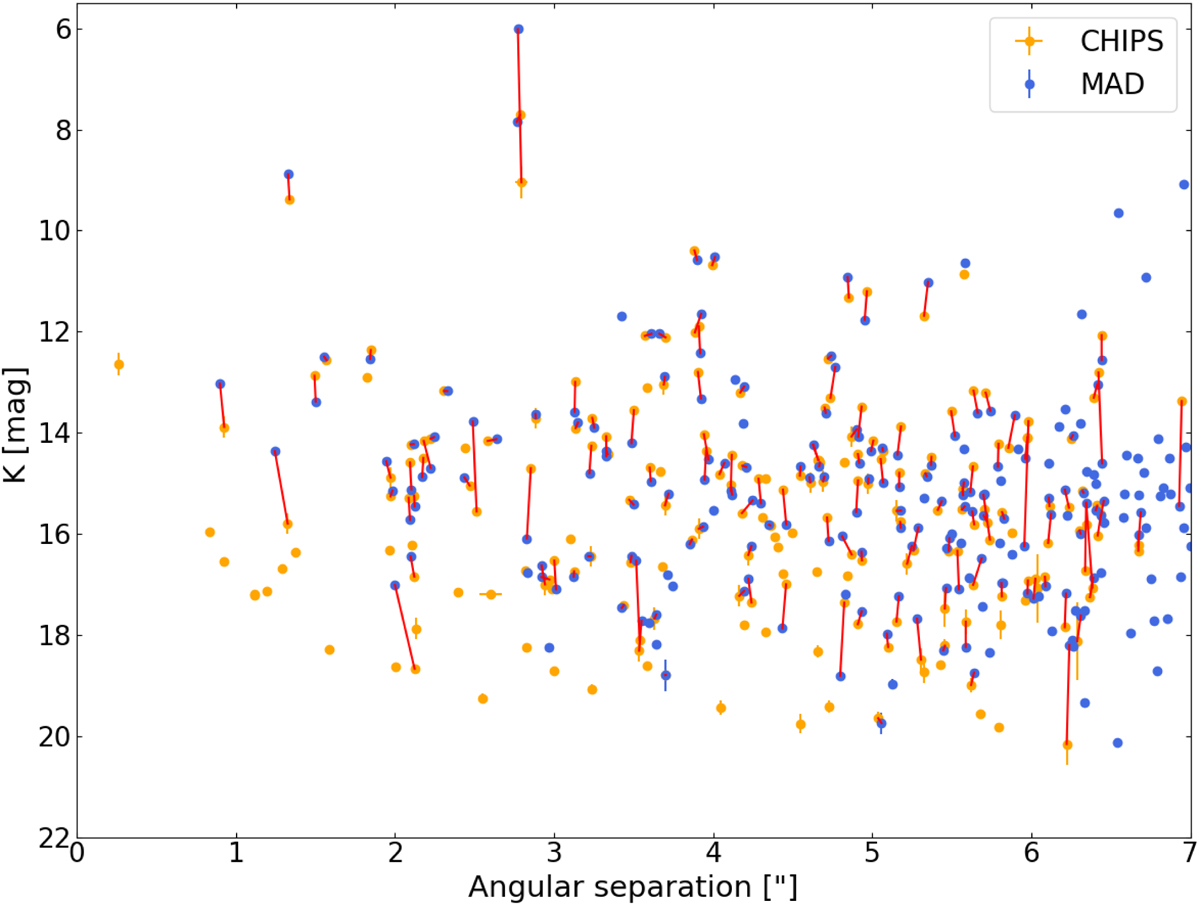
K-band magnitude distribution of detected sources in the Trumpler 14 cluster with the CHIPS (orange; K1) and MAD (blue;KS) samples as a function of angular separation from the central star. Sources within 0![]() 1 from one another are connected by a solid red line. MAD sources brighter than K = 8 are likely impacted by non-linearity and/or saturation effects impacting the MAD observations.
1 from one another are connected by a solid red line. MAD sources brighter than K = 8 are likely impacted by non-linearity and/or saturation effects impacting the MAD observations.
Current usage metrics show cumulative count of Article Views (full-text article views including HTML views, PDF and ePub downloads, according to the available data) and Abstracts Views on Vision4Press platform.
Data correspond to usage on the plateform after 2015. The current usage metrics is available 48-96 hours after online publication and is updated daily on week days.
Initial download of the metrics may take a while.