Fig. 8
Download original image
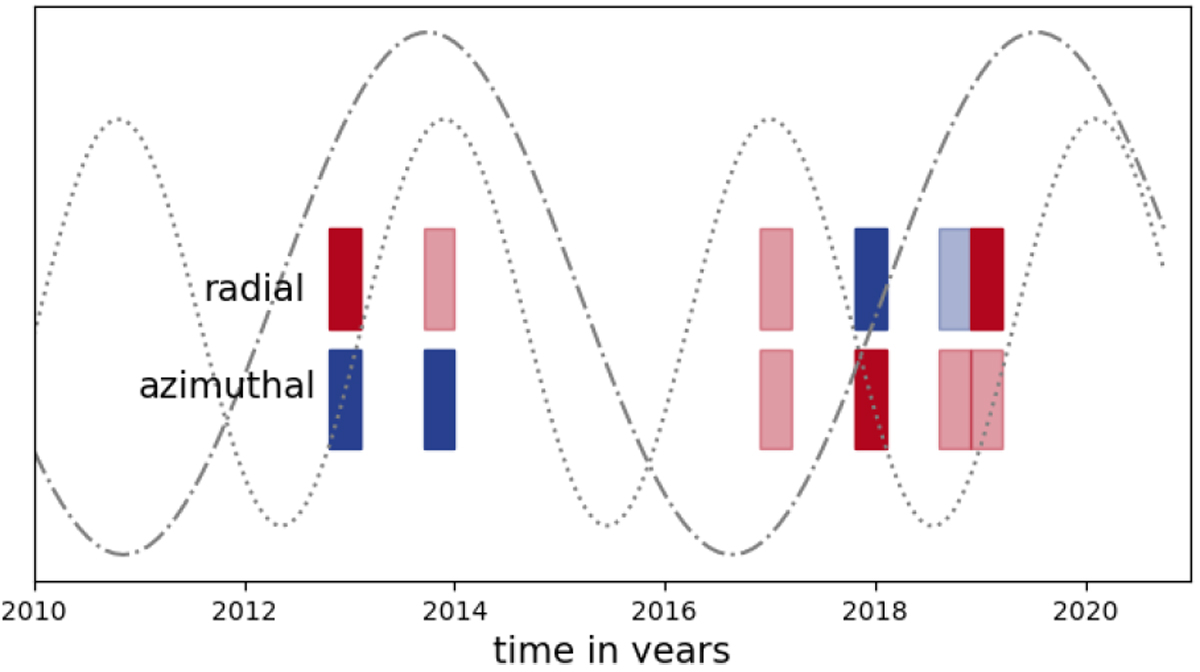
Relation between the 5.7 yr (dotted and dashed grey curve) and 3.1 yr (dotted grey curve) chromospheric activity cycles, and the polarity reversals in the radial (top row of rectangles) and azimuthal magnetic field (bottom row of rectangles). The red rectangles represent dominant positive polarity magnetic field and the blue rectangles represent dominant negative polarity magnetic field. The transparent rectangles mark epochs when additional opposite polarity magnetic regions are also detected in addition to the dominant polarity.
Current usage metrics show cumulative count of Article Views (full-text article views including HTML views, PDF and ePub downloads, according to the available data) and Abstracts Views on Vision4Press platform.
Data correspond to usage on the plateform after 2015. The current usage metrics is available 48-96 hours after online publication and is updated daily on week days.
Initial download of the metrics may take a while.