Fig. 6
Download original image
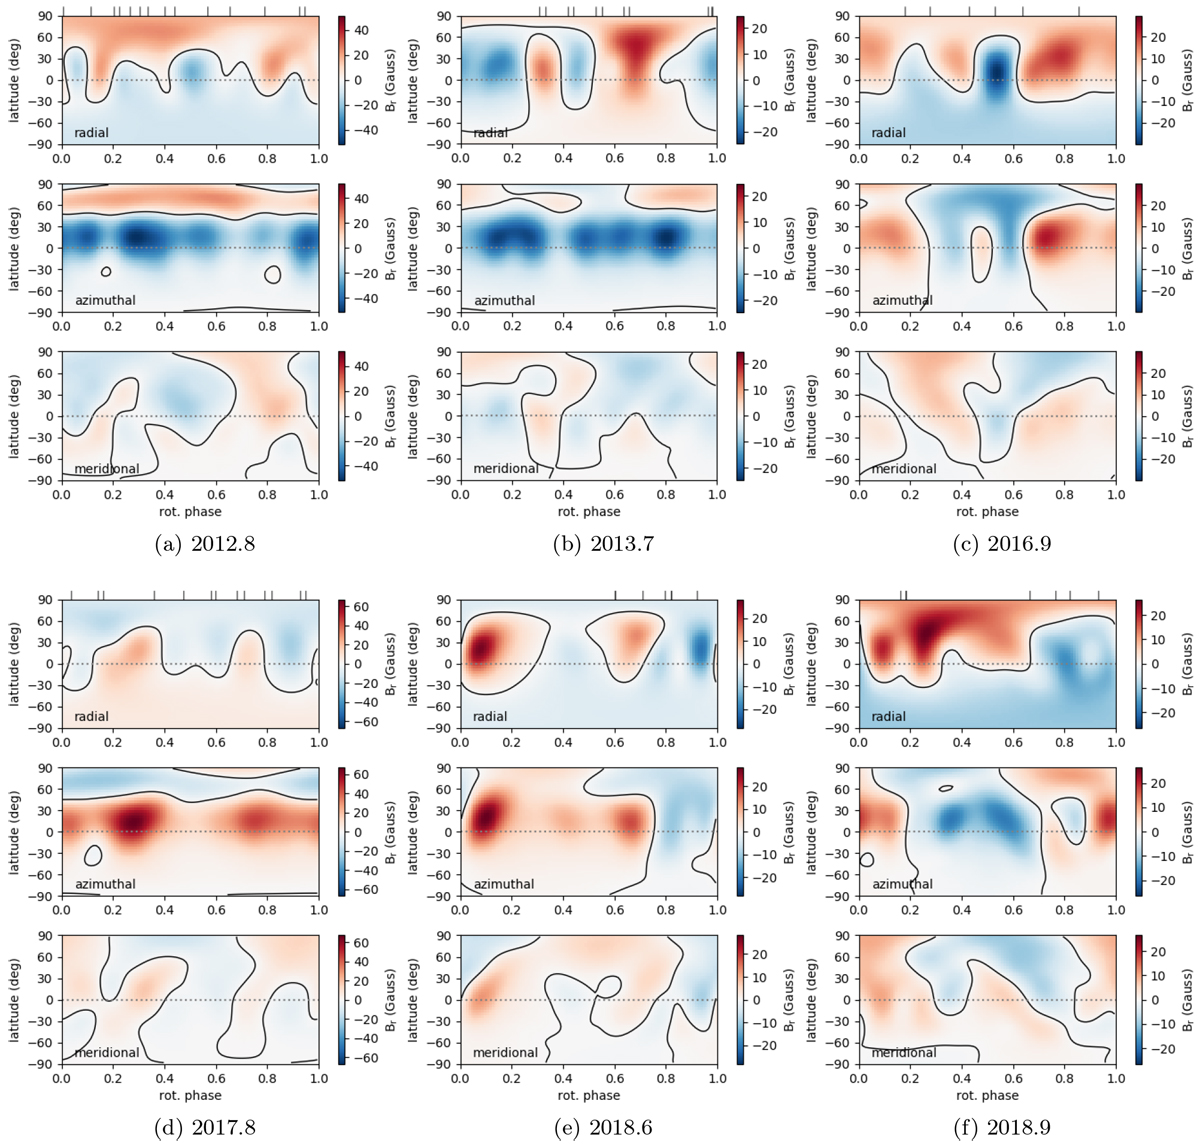
Surface magnetic maps of κ Ceti for six observational epochs. The large-scale radial, azimuthal and meridional field is shown in each sub-plot. The rotational phase is shown in the x-axis and the latitude is shown in the y-axis. The equator is marked by a horizontal dotted line. The magnetic field strength is shown in gauss, where red denotes positive polarity and blue denotes negative polarity. The black tick marks at the top mark the observed rotational phases. The colour scale is determined based on the maximum magnetic field strength in each ZDI map.
Current usage metrics show cumulative count of Article Views (full-text article views including HTML views, PDF and ePub downloads, according to the available data) and Abstracts Views on Vision4Press platform.
Data correspond to usage on the plateform after 2015. The current usage metrics is available 48-96 hours after online publication and is updated daily on week days.
Initial download of the metrics may take a while.