Fig. 5
Download original image
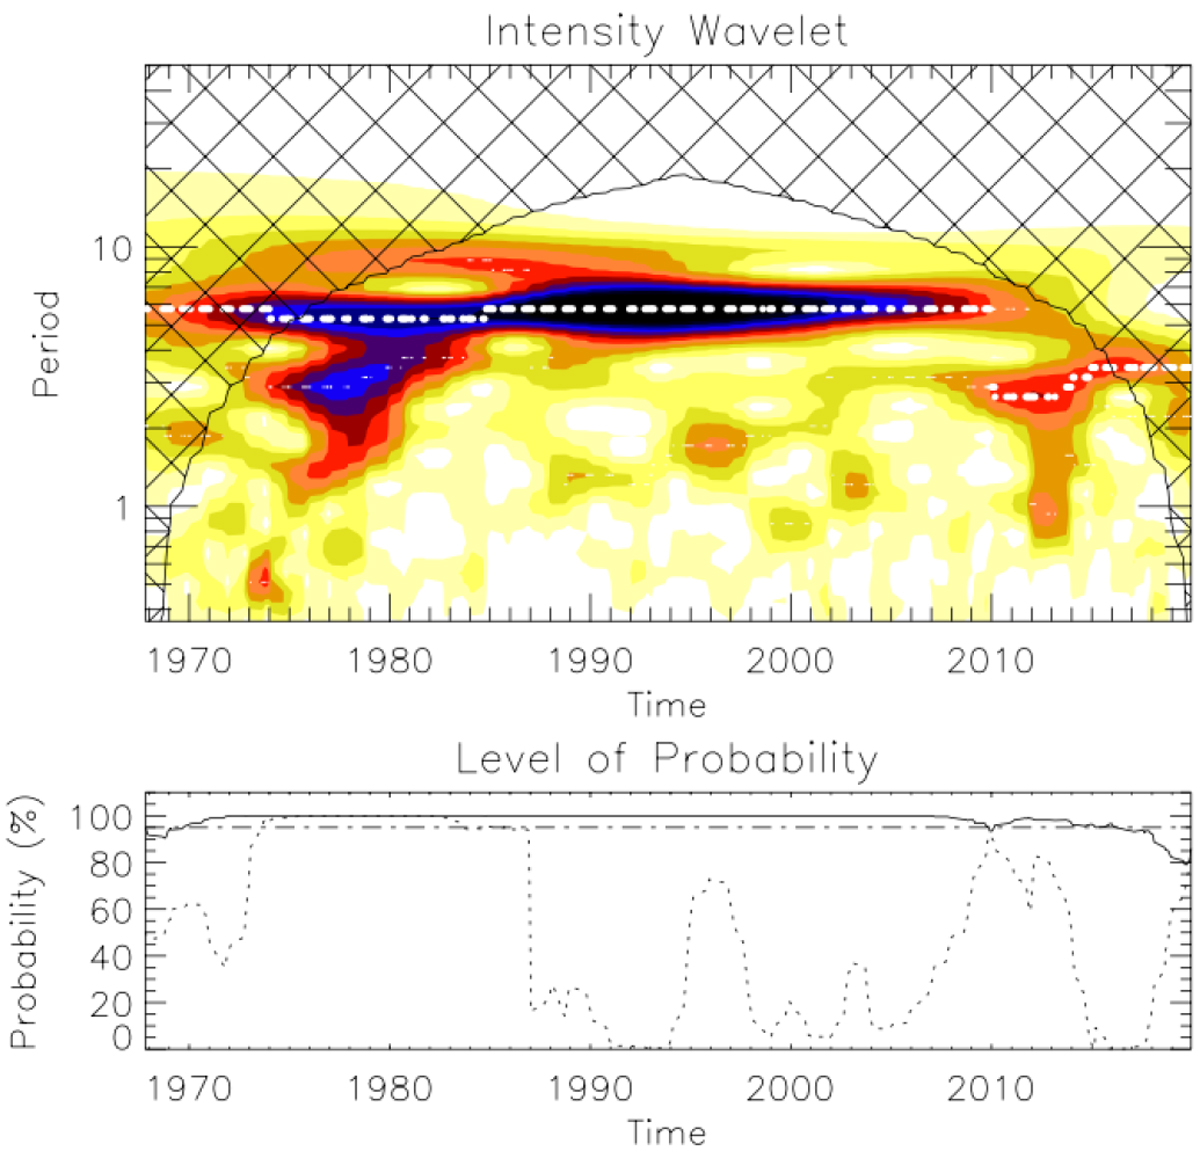
Top: wavelet intensity spectrum of monthly averaged SMWO of κ Ceti. The strongest cycle periods are represented by the darker colours and the dashed horizontal white lines, and the cross-hatched area shows the COI. Bottom: the probability associated with the two detected periods of 5.8 (solid black line) and 3.1 (dotted black line) years. The 90% probability level is shown as a horizontal dashed and dotted line.
Current usage metrics show cumulative count of Article Views (full-text article views including HTML views, PDF and ePub downloads, according to the available data) and Abstracts Views on Vision4Press platform.
Data correspond to usage on the plateform after 2015. The current usage metrics is available 48-96 hours after online publication and is updated daily on week days.
Initial download of the metrics may take a while.