Fig. 1
Download original image
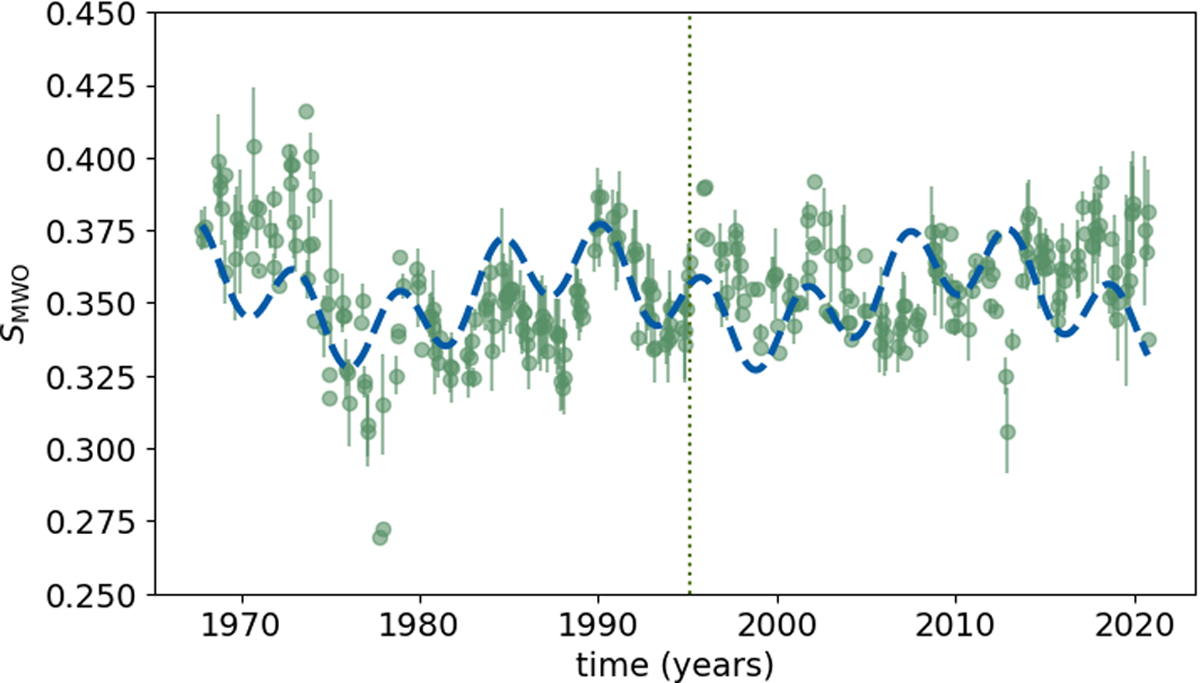
S-index (SMWO) vs time. Monthly averaged values are plotted as green circles, where the dispersion is shown as error bars. The dotted vertical line separates the SMWO from this work (to the right of the vertical line) and Boro Saikia et al. (2018b) (to the left of the vertical line). The best fit cycle periods (22.3 and 5.7 yr) from Boro Saikia et al. (2018b) are shown in blue.
Current usage metrics show cumulative count of Article Views (full-text article views including HTML views, PDF and ePub downloads, according to the available data) and Abstracts Views on Vision4Press platform.
Data correspond to usage on the plateform after 2015. The current usage metrics is available 48-96 hours after online publication and is updated daily on week days.
Initial download of the metrics may take a while.