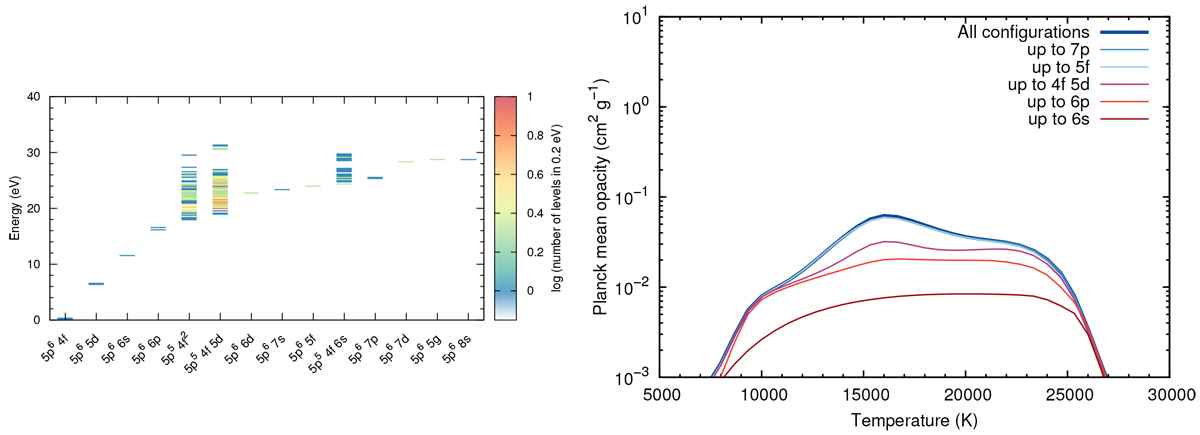
Fig. 31
Download original image
Effects of completeness of the atomic data on the Planck mean opacity. Left panel: Distribution of the energy levels from individual configurations as obtained from HULLAC. The number of energy levels inside 0.2 eV bins is represented as in the color scale. Right panel: Planck mean opacity as a function of temperature as calculated using the atomic data from HULLAC. The thick blue line is the opacity calculated using the full set of configurations, whereas the other lines correspond to the opacity calculated using only a subset of configurations. The opacity is unaffected by the removal of the energy levels corresponding to the configurations 5p68s, 5p65g, and so on down to 5p5 4f 6s (the blue curves). However, further removal of the energy levels (e.g., those corresponding to the configurations 5p65f, 5p66d and so on) results in a drop in the opacity (see red curves) from the default value calculated using the full atomic data (the thick blue curve).
Current usage metrics show cumulative count of Article Views (full-text article views including HTML views, PDF and ePub downloads, according to the available data) and Abstracts Views on Vision4Press platform.
Data correspond to usage on the plateform after 2015. The current usage metrics is available 48-96 hours after online publication and is updated daily on week days.
Initial download of the metrics may take a while.