Fig. 26
Download original image
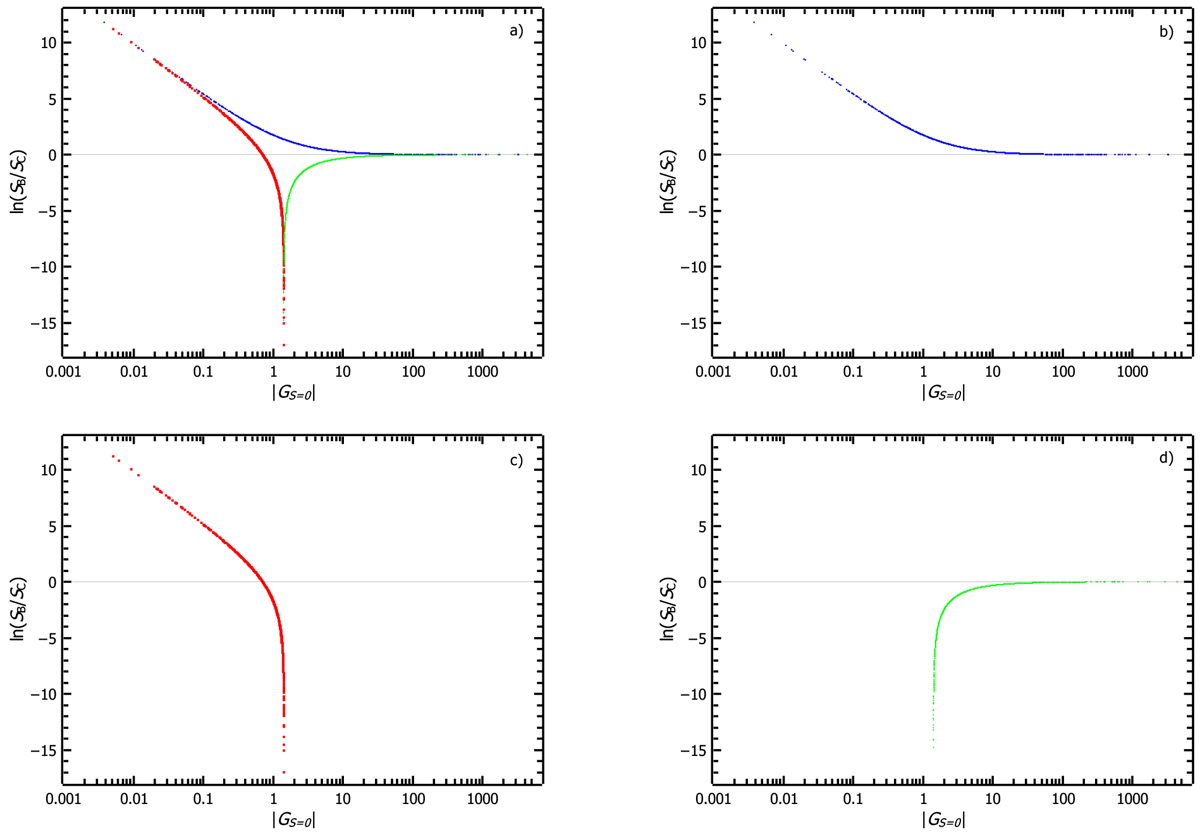
Natural logarithm of the ratio of the line strength S in the Babushkin form to the line strength S in the Coulomb form, as a function of the GS = 0 parameter. The figures show the results of present transition calculations (each dot represents a certain transition). Panel (a) shows three distinct parts, each plotted on a separate graph: (1) the upper part of the graph (blue points), where − ∞ <GS = 0 < 0 (or part b); (2) the lower left part of the graph (red points), where ![]() (or part c); and (3) the lower right part of the graph (green points), where
(or part c); and (3) the lower right part of the graph (green points), where
![]() (or part d).
(or part d).
Current usage metrics show cumulative count of Article Views (full-text article views including HTML views, PDF and ePub downloads, according to the available data) and Abstracts Views on Vision4Press platform.
Data correspond to usage on the plateform after 2015. The current usage metrics is available 48-96 hours after online publication and is updated daily on week days.
Initial download of the metrics may take a while.