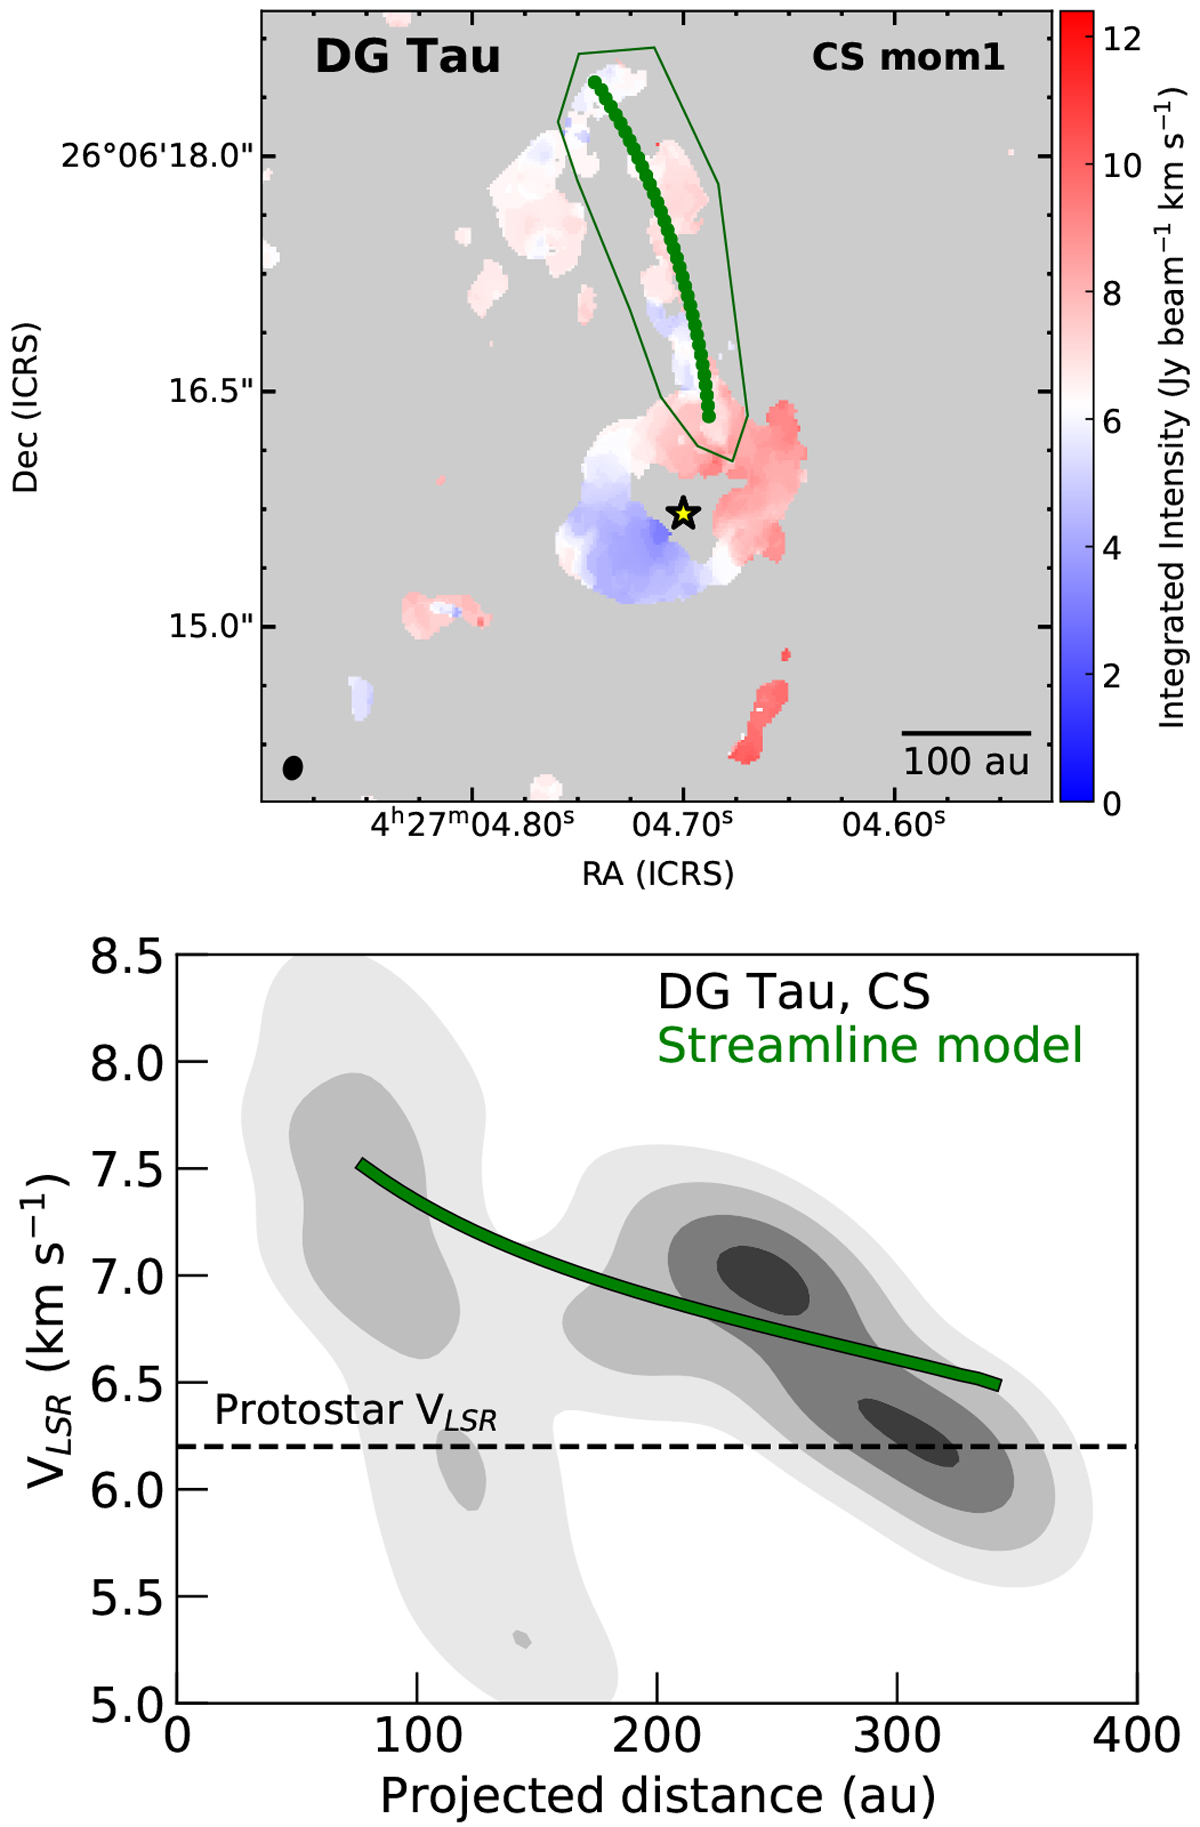
Fig. B.1
Download original image
Infalling streamline model for the DG Tau streamer. Top: Streamline model, plotted in green, on top of the moment-1 map of CS, spatially matching the observed streamer emission to the north (outlined in the green polygon). Bottom: Velocity components of CS taken from inside the green polygon plotted as a function of projected distance from the central young stellar object, with varying levels of kernel density estimation of the velocity plotted as filled contours. The contours start at 0.5σ and progressin steps of 0.5σ, where σ is from a bivariate normal distribution (see also Pineda et al. 2020). The streamline model, shown in green, describes most of the kinematics of the system in addition to the spatial match shown in the top panel. The main deviation is a small amount of blue-shifted emission in the streamer at a projected distance of ~100-150 au from the central young stellar object.
Current usage metrics show cumulative count of Article Views (full-text article views including HTML views, PDF and ePub downloads, according to the available data) and Abstracts Views on Vision4Press platform.
Data correspond to usage on the plateform after 2015. The current usage metrics is available 48-96 hours after online publication and is updated daily on week days.
Initial download of the metrics may take a while.