Fig. 5
Download original image
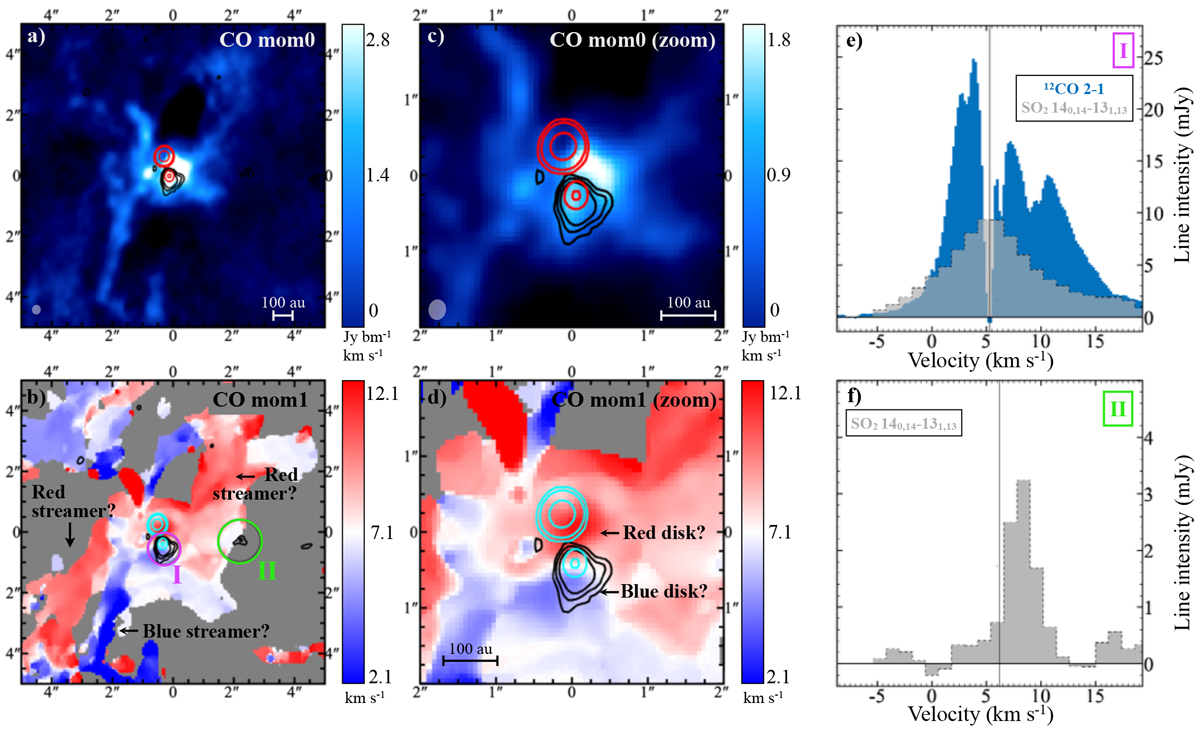
Imagery of T Tau. (a) Moment 0 of the 12CO 2−1 line. (d) Moment 1 of the 12CO 2−1 line. (c) Same as (a) on a smaller scale. (d) Same as (b) on a smaller scale. (e) Integrated spectra of CO and SO2 140,14 − 131,13 from the region labeled I in (b). (f) Integrated spectra of SO2 140,14 − 131,13 from the region labeled II in (b). In each panel, red (or cyan) and black contours indicate the continuum and line emission as in Fig. 1. North is up, east is left.
Current usage metrics show cumulative count of Article Views (full-text article views including HTML views, PDF and ePub downloads, according to the available data) and Abstracts Views on Vision4Press platform.
Data correspond to usage on the plateform after 2015. The current usage metrics is available 48-96 hours after online publication and is updated daily on week days.
Initial download of the metrics may take a while.