Fig. 3
Download original image
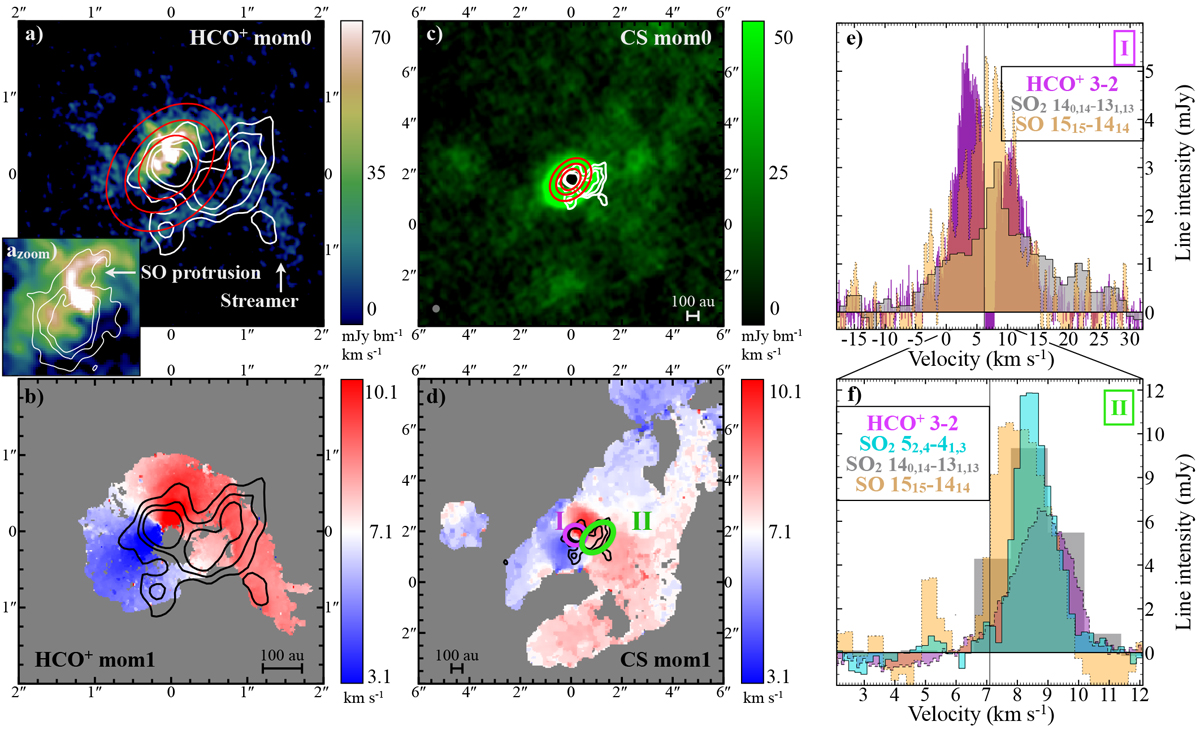
Imagery of HL Tau. (a) Moment 0 of the HCO+ 3−2 line (Yen et al. 2019). (azoom): zoom onto the central region of a. (b) Moment 1 of the HCO+ 3−2 line. (c) Moment 0 of the CS 5−4 line. (d) Moment 1 of the CS 5−4 line. (e) Integrated spectra of HCO+, SO2 140,14 − 131,13, and SO 1515−1414 from the region labelled I in (d). (f) Integrated spectra of HCO+, SO2 140,14 − 131,13 and 52,4 −41,3 from the region labeled II in (b). In each map, red and white (or black) contours indicate the continuum and SO2 140,14 − 131,13 line emissionas in Fig. 1, except contours from (azoom) that indicatethe SO 1515−1414 line emission. The arrow points to the inner part of the HCO+ streamer visible as a SO protrusion. North is up, east is left.
Current usage metrics show cumulative count of Article Views (full-text article views including HTML views, PDF and ePub downloads, according to the available data) and Abstracts Views on Vision4Press platform.
Data correspond to usage on the plateform after 2015. The current usage metrics is available 48-96 hours after online publication and is updated daily on week days.
Initial download of the metrics may take a while.