Fig. 1
Download original image
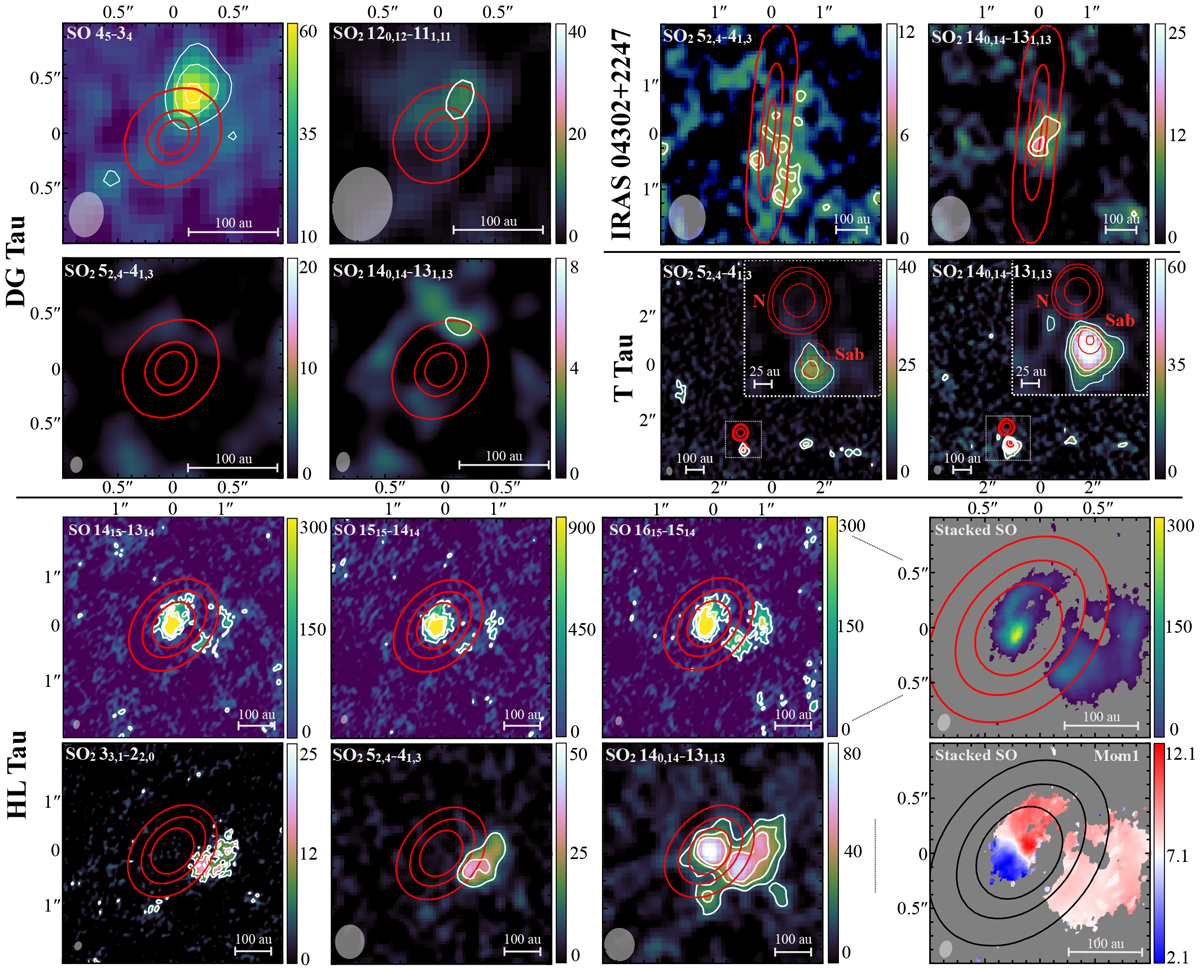
Moment-0 maps of SO and SO2 emission.The red and white contours indicate the continuum at 1.3 mm and line emission, respectively. The continuum contours of DG Tau are at 15, 90, and 160σ significance while the line contours at 4, 8, and 12σ; the continuum contours of IRAS 04302 are at 14, 200, and 400σ while the line contours are at 3 and 4σ; the continuum contours of T Tau are at 50, 140, and 1000σ while the line contours are at 3, 5, and 8σ; the continuum contours of HL Tau are at 8, 40, and 80σ while the SO2 line contoursare at 5, 10, and 15σ and SO line contours are at 3, 6, and 9σ. A zoom onto T Tau N and S is shown in the inset image of the source. Panels in the last column of HL Tau are the zoomed-in moment-0 and moment-1 maps of the stacked SO emission. We note that only contours at ≥ 5σ denote formal detection. The beam size is indicated by the gray ellipse to the bottom left. Color units are mJy beam−1 km s−1 in the moment-0 and km s−1 in the moment-1 maps, respectively. North is up, east is left.
Current usage metrics show cumulative count of Article Views (full-text article views including HTML views, PDF and ePub downloads, according to the available data) and Abstracts Views on Vision4Press platform.
Data correspond to usage on the plateform after 2015. The current usage metrics is available 48-96 hours after online publication and is updated daily on week days.
Initial download of the metrics may take a while.