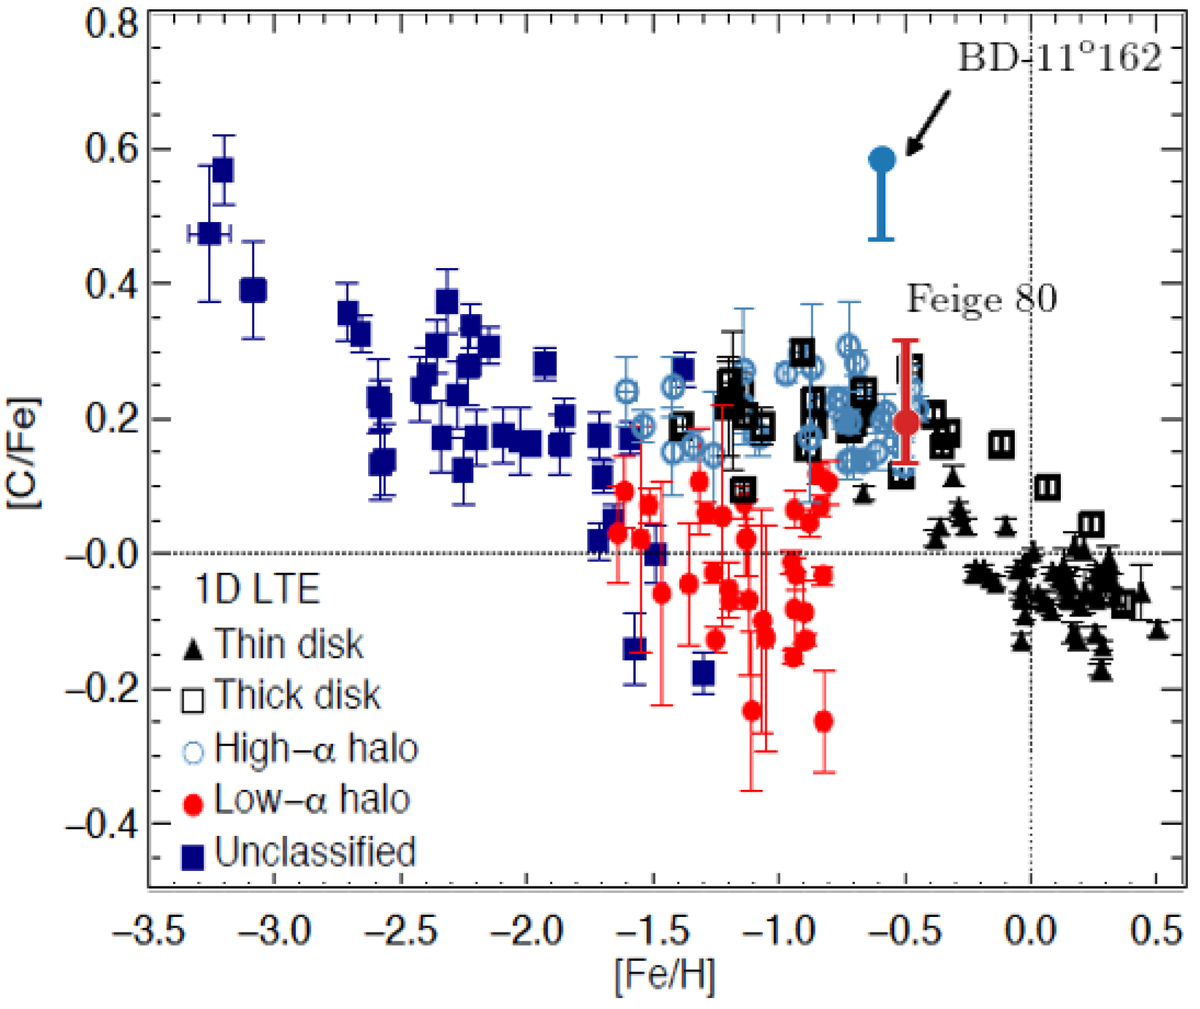
Fig. 7.
Download original image
Carbon-to-iron abundance ratios. The sample consists of three different datasets of F and G dwarfs used by Amarsi et al. (2019b): the 67 disk stars (mainly of the thin disk, and including the Sun) in the HARPS-FEROS sample of Nissen et al. (2014); the 85 thick-disk and halo stars in the UVES-FIES sample of Nissen et al. (2014); and the 40 halo stars in the VLT/UVES sample of Nissen et al. (2007), which were recently reanalysed by Amarsi et al. (2019a). This plot, originally used in Amarsi et al. (2019b), has been adapted to include BD−11o162 (blue circle) and Feige 80 (dark red circle) and their error bars (1σ). Units are in dex.
Current usage metrics show cumulative count of Article Views (full-text article views including HTML views, PDF and ePub downloads, according to the available data) and Abstracts Views on Vision4Press platform.
Data correspond to usage on the plateform after 2015. The current usage metrics is available 48-96 hours after online publication and is updated daily on week days.
Initial download of the metrics may take a while.