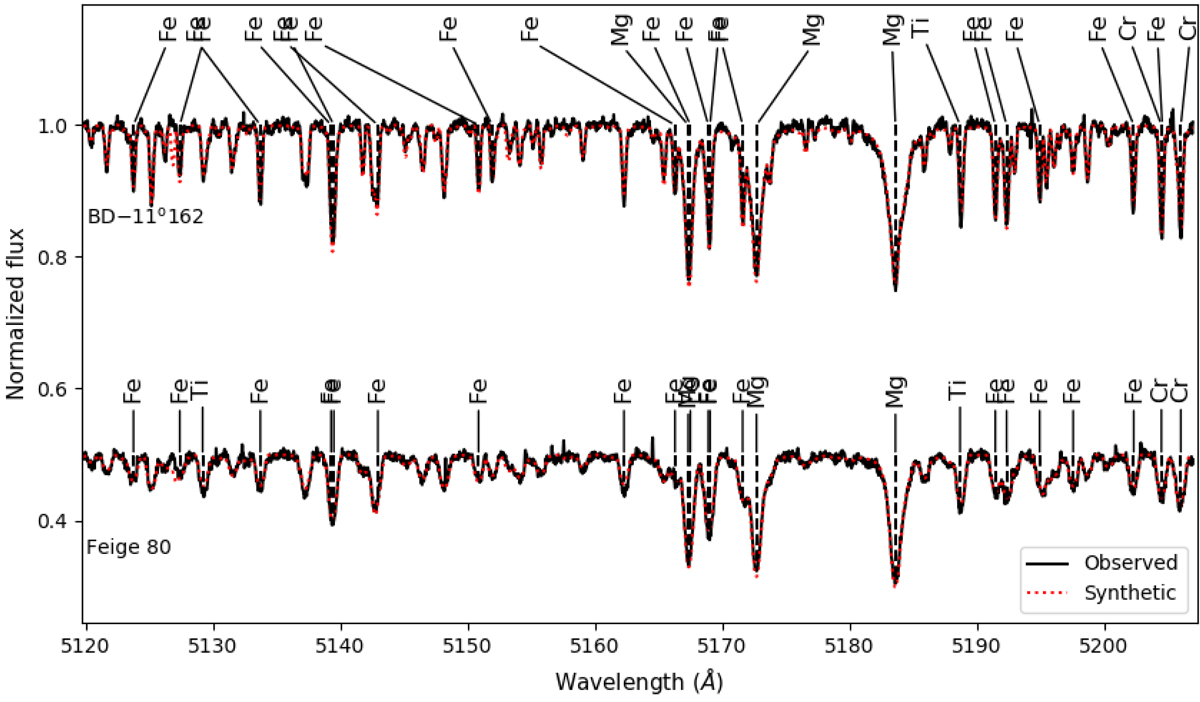
Fig. C.2.
Download original image
Observed normalised spectrum (solid black line) and the best fitting GSSP model (dotted red line) for the wavelength range 5120-5210 Å. It includes the strong Mg I triplet at 5167, 5172, and 5183 Å, which is used to determine the Mg abundance. To prevent label overlapping, an intensity threshold was applied for the line labelling.
Current usage metrics show cumulative count of Article Views (full-text article views including HTML views, PDF and ePub downloads, according to the available data) and Abstracts Views on Vision4Press platform.
Data correspond to usage on the plateform after 2015. The current usage metrics is available 48-96 hours after online publication and is updated daily on week days.
Initial download of the metrics may take a while.