Free Access
Fig. 12.
Download original image
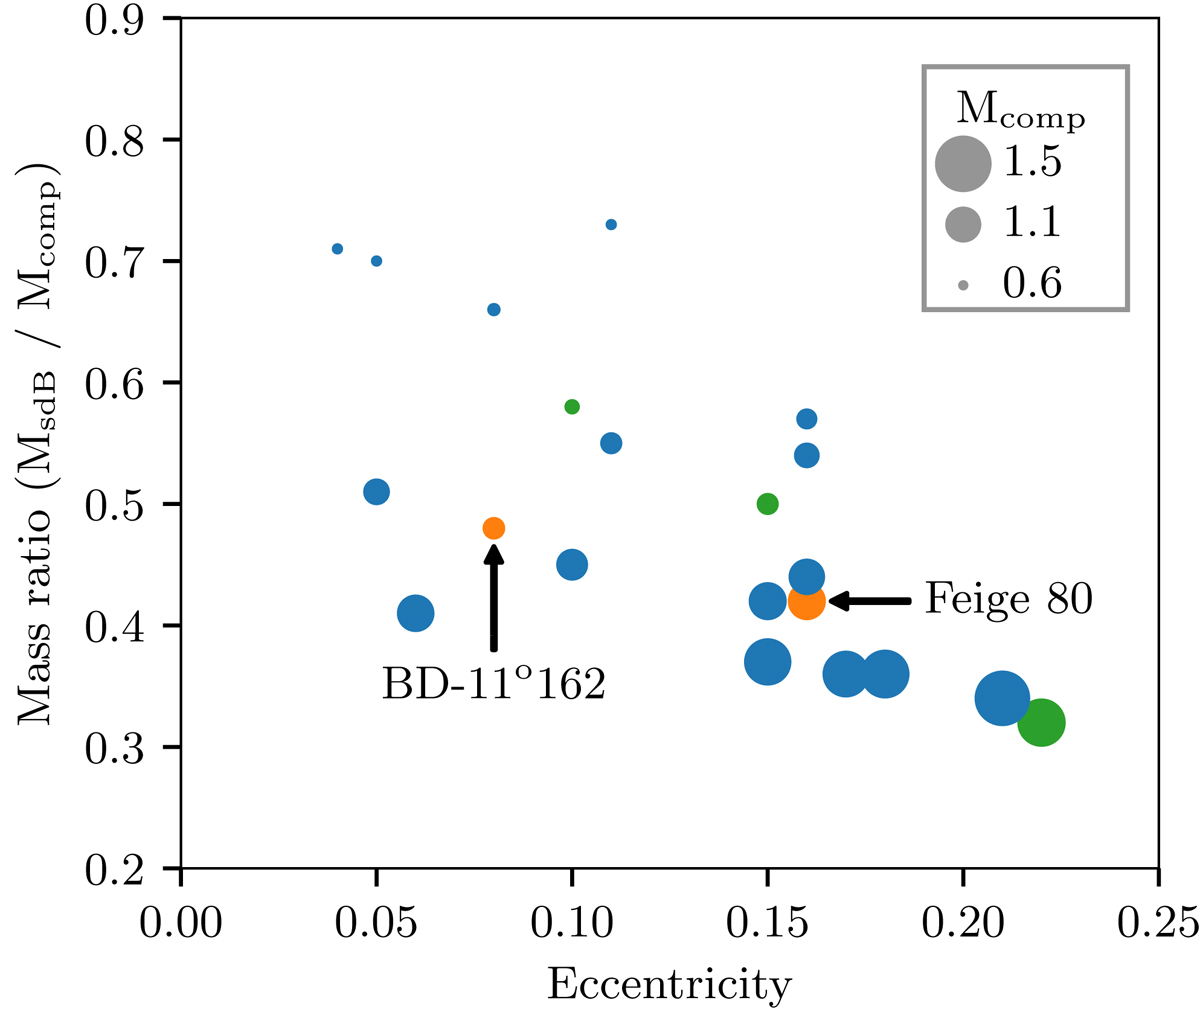
Mass ratio-eccentricity distribution. Group II is shown in green. Bubble size indicates the MS companion mass (to make the differences clear, they are plotted as MS mass minus 0.6 M⊙). For clarity, error bars are not included. Orbital parameters are obtained from Vos et al. (2019).
Current usage metrics show cumulative count of Article Views (full-text article views including HTML views, PDF and ePub downloads, according to the available data) and Abstracts Views on Vision4Press platform.
Data correspond to usage on the plateform after 2015. The current usage metrics is available 48-96 hours after online publication and is updated daily on week days.
Initial download of the metrics may take a while.