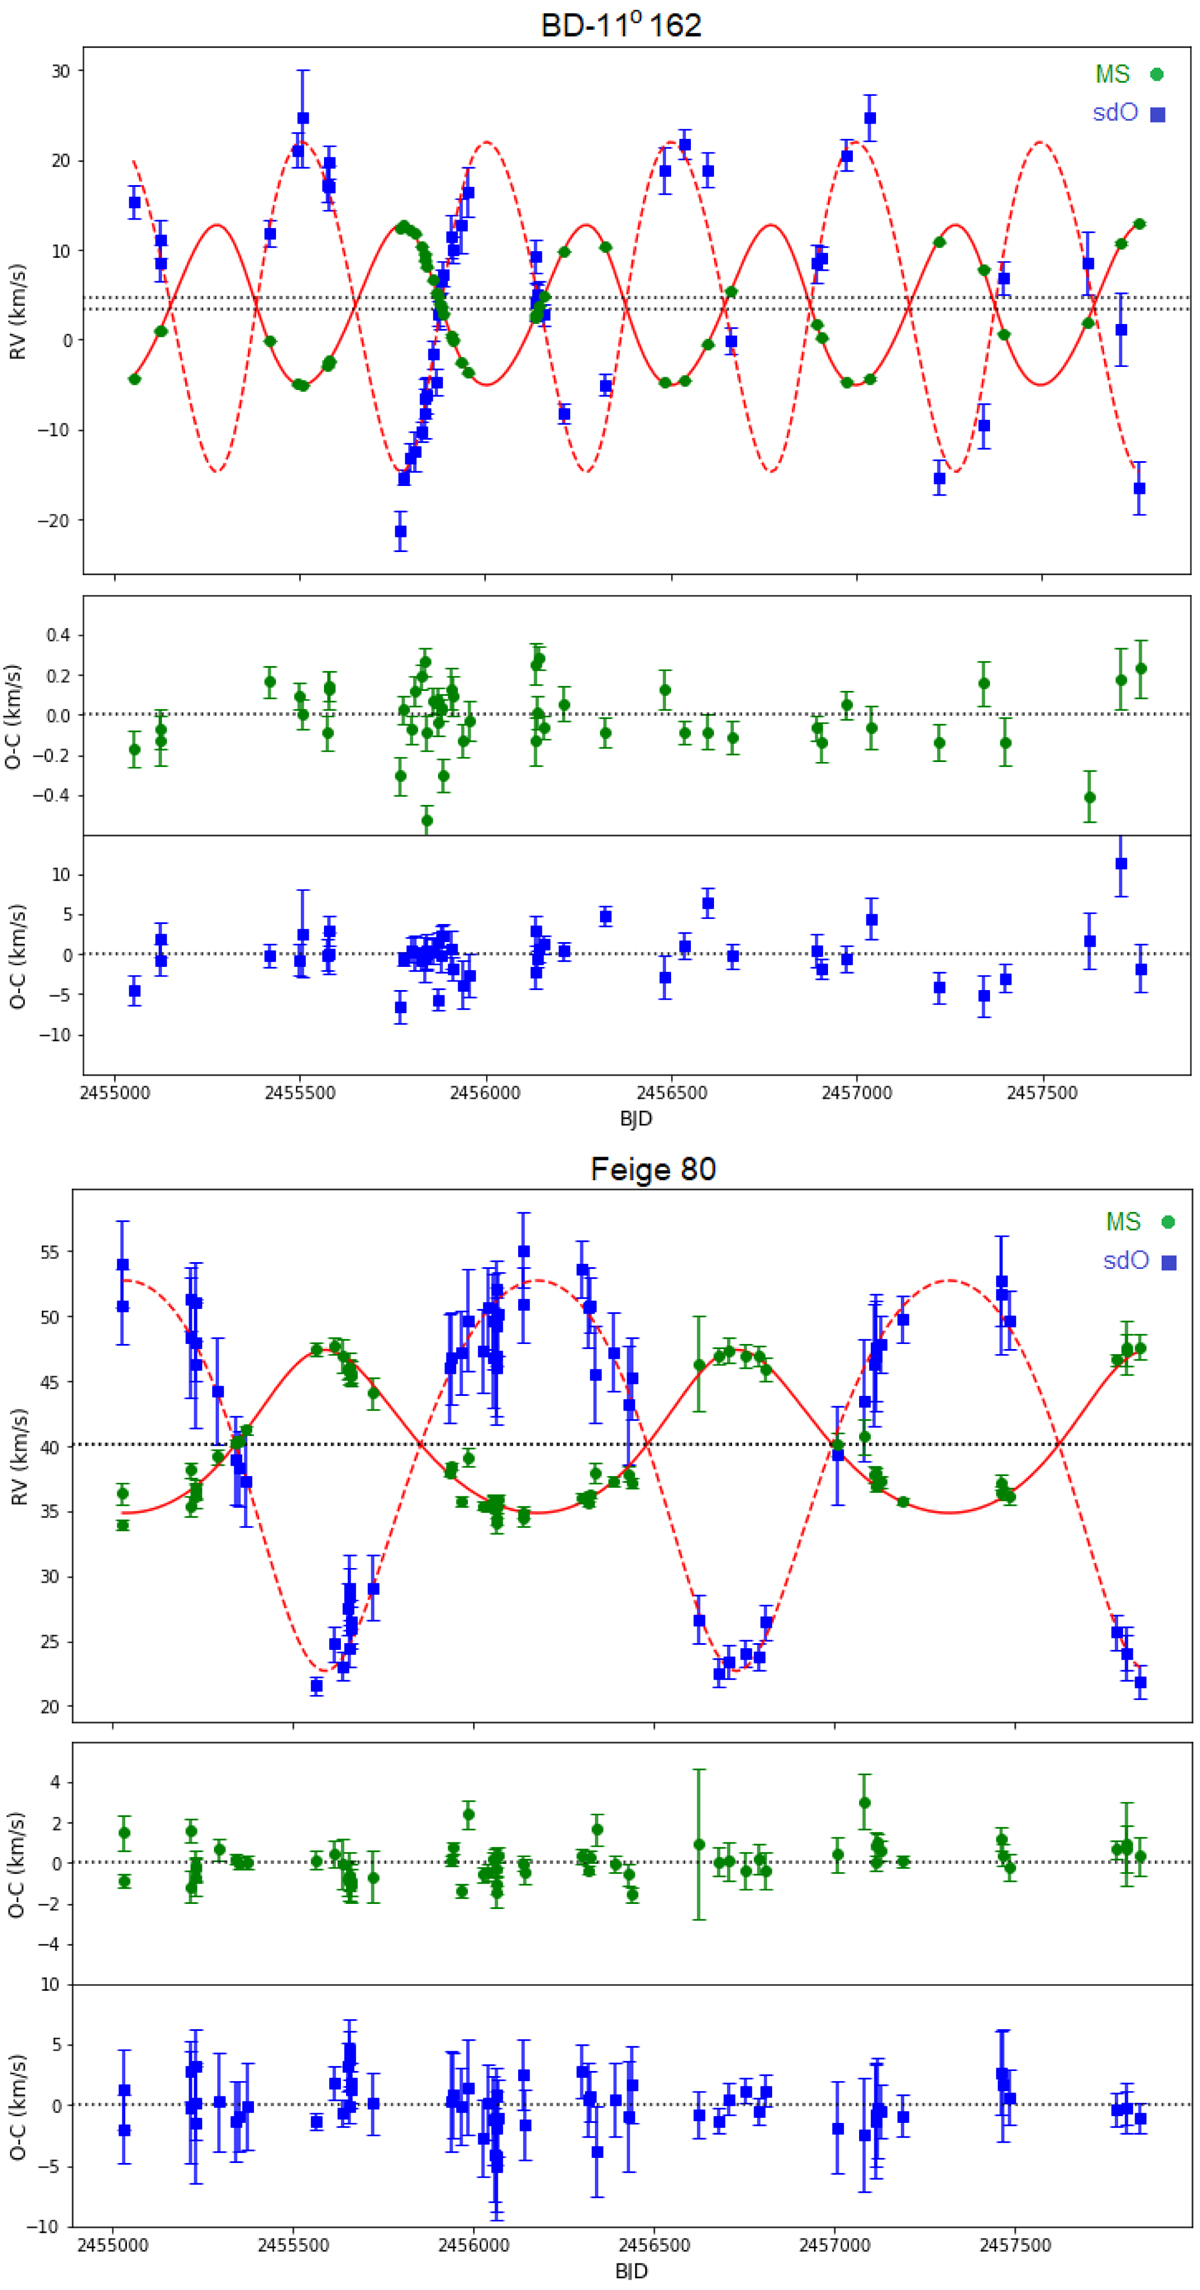
Fig. 1.
Download original image
RV curves and residuals (O-C) from individual observations of BD−11o162 (upper) and Feige 80 (bottom). The RVs of the cool companions are plotted with green filled circles, and those of the sdO are shown as blue squares. RV error bars (1σ) obtained by MC simulations, as described in Sect. 3.1, are also included. The best Keplerian orbits simultaneously fitted (MS+sdO) are shown as solid red lines for the cool companions and dashed red lines for the sdOs.
Current usage metrics show cumulative count of Article Views (full-text article views including HTML views, PDF and ePub downloads, according to the available data) and Abstracts Views on Vision4Press platform.
Data correspond to usage on the plateform after 2015. The current usage metrics is available 48-96 hours after online publication and is updated daily on week days.
Initial download of the metrics may take a while.