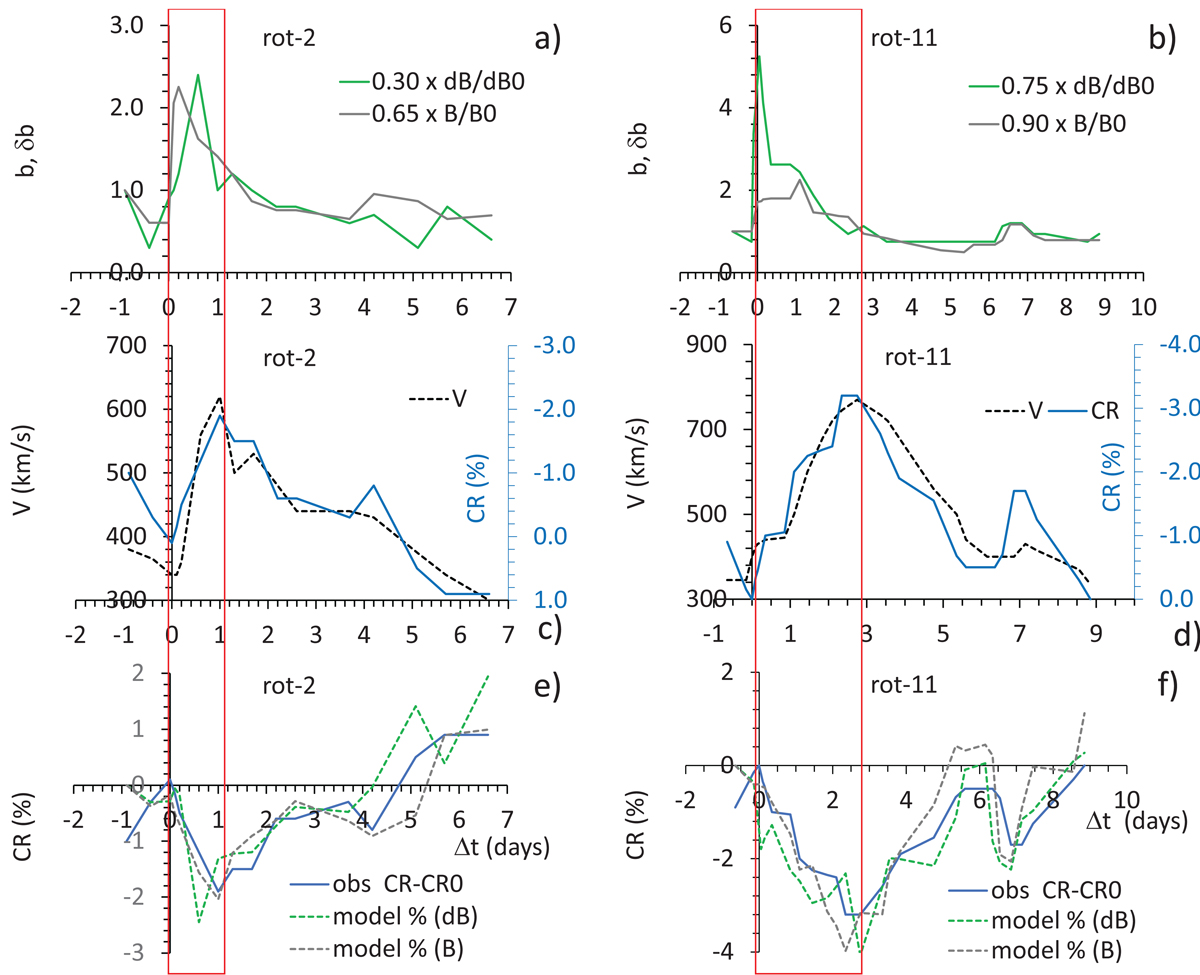
Fig. 5.
Download original image
Comparison of the model results and observations for two CIR events. Left: rot-2 (DOY = 184 and 191, 2007). Right: rot-11 (DOY = 58–68, 2008). Panels a and b: magnetic field and its fluctuations normalized with respect to the pre-event values (b and δb, gray and green; respectively). Panels c and d: solar-wind flow speed (dashed black) and the inverted CR(t) graph (blue). Panels e and f: observed CR(t) values (blue) compared to the model results based on the behavior of b (dashed gray) and δb (dashed green).
Current usage metrics show cumulative count of Article Views (full-text article views including HTML views, PDF and ePub downloads, according to the available data) and Abstracts Views on Vision4Press platform.
Data correspond to usage on the plateform after 2015. The current usage metrics is available 48-96 hours after online publication and is updated daily on week days.
Initial download of the metrics may take a while.