Fig. 3
Download original image
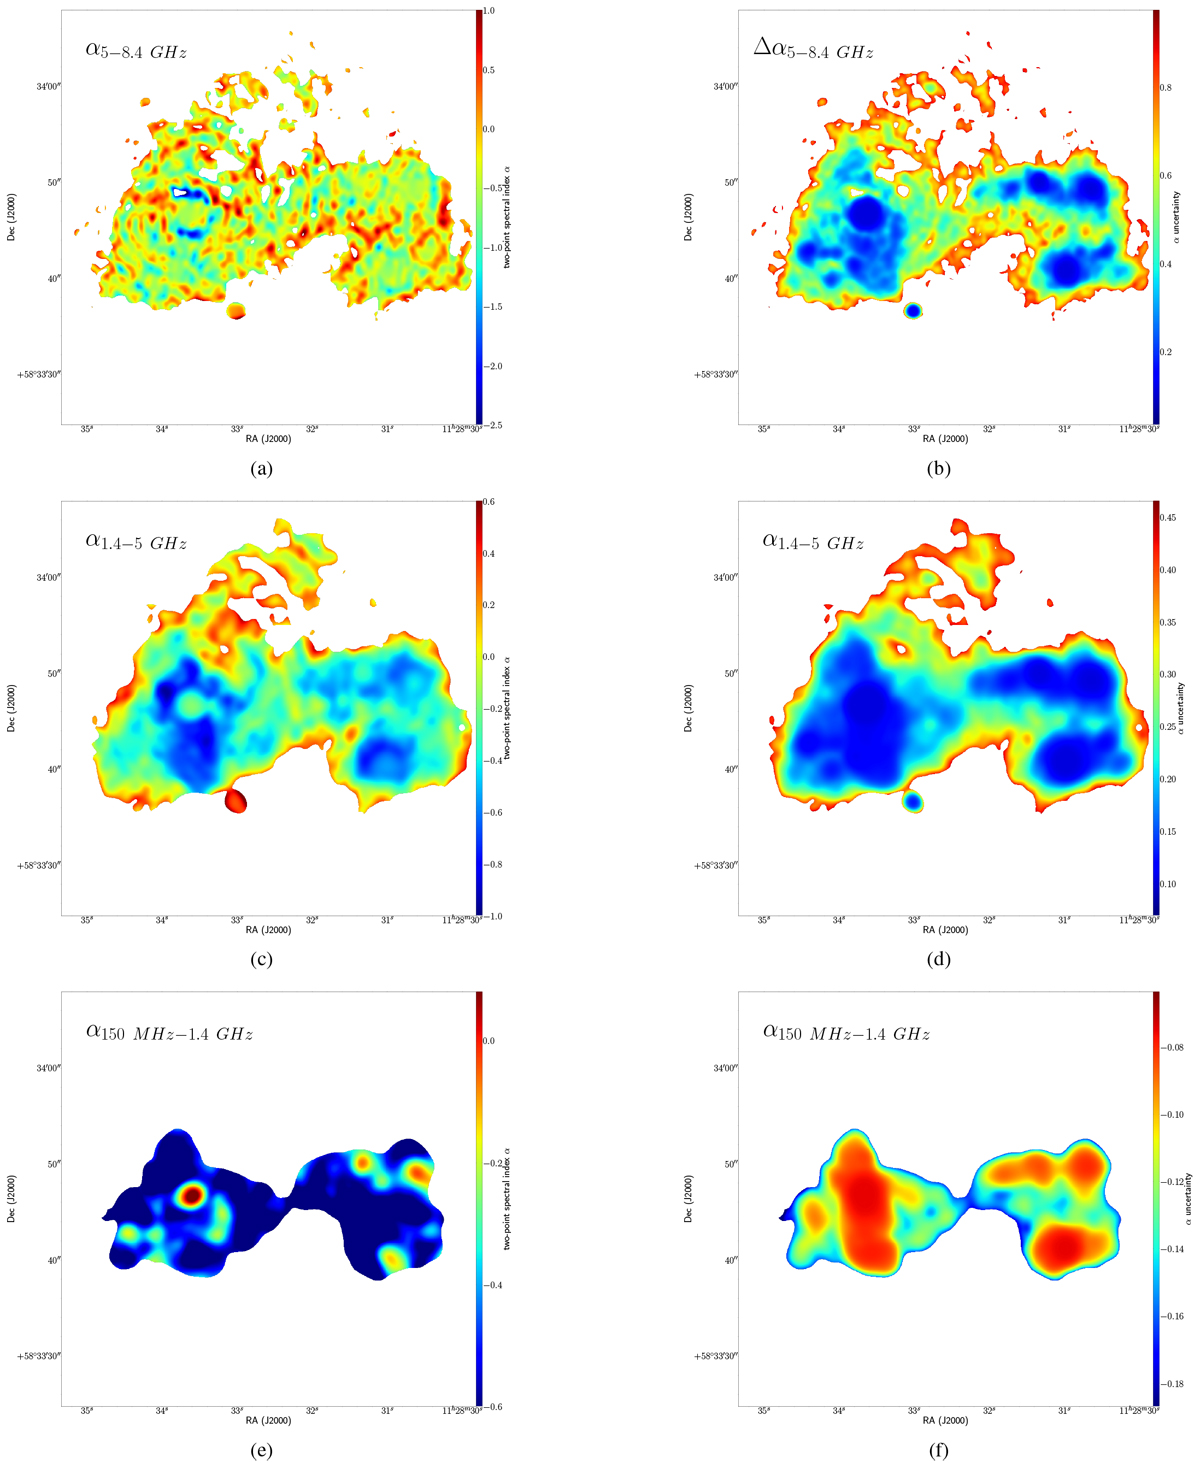
Blanked spectral index maps (left) and its spectral uncertainties (right). Plots for the spectral index maps; (a) corresponds to α8.4−5 GHz) at a resolution of 0.8″ × 0.8″, (c) to α(5.0−1.4 GHz) at a resolution of 1.4″ × 1.4″, and (e) to α(1.4 GHz−150 MHz) at a resolution of 1.4″ × 1.4″. Right: total spectral index error (taking into account Eq. (1)) at the frequencies given by the left image of each one. For more details, see Sect. 3.2.3.
Current usage metrics show cumulative count of Article Views (full-text article views including HTML views, PDF and ePub downloads, according to the available data) and Abstracts Views on Vision4Press platform.
Data correspond to usage on the plateform after 2015. The current usage metrics is available 48-96 hours after online publication and is updated daily on week days.
Initial download of the metrics may take a while.