Fig. 2
Download original image
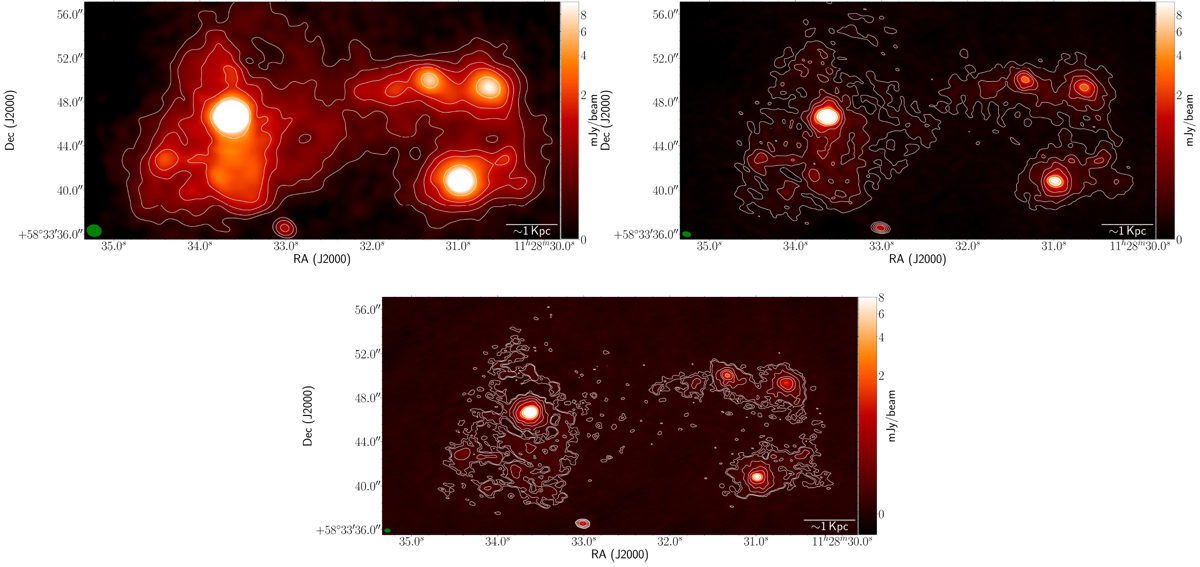
Images of Arp 299 observed with the JVLA at 1.4 GHz (top-left), 5 GHz (top-right), and 8.4 GHz (bottom). Contour levels are drawn at (3,5,10,20,35,50,100,200,230,250) × rms at each band (see Table 1). The green ellipse in the lower left corner corresponds to the synthesized beam.
Current usage metrics show cumulative count of Article Views (full-text article views including HTML views, PDF and ePub downloads, according to the available data) and Abstracts Views on Vision4Press platform.
Data correspond to usage on the plateform after 2015. The current usage metrics is available 48-96 hours after online publication and is updated daily on week days.
Initial download of the metrics may take a while.