Fig. 11
Download original image
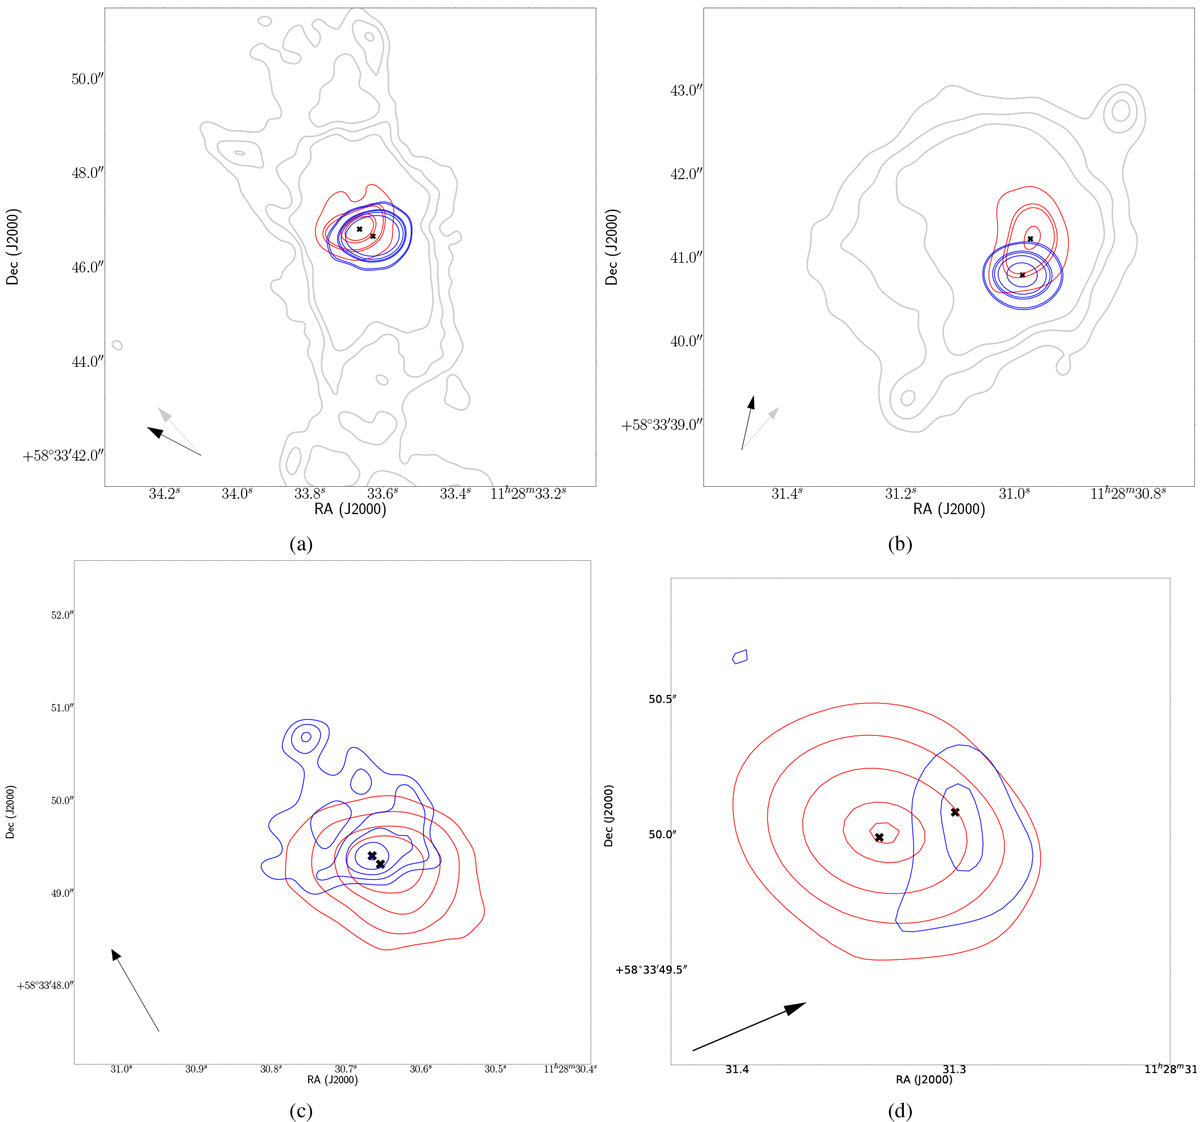
Contour plots of Arp 299-A (a), Arp 299-B nuclei (b), and (c) C and (d) C′ compact components. The red and blue contours represent the local brightest values at 150 MHz and 8.4 GHz, respectively.The grey contours in a and b show the values that shape the structures present in the two nuclei (the starburst driven outflow for A-nucleus and the assumed bowshock for B-nucleus) and detected at 150 MHz by LOFAR (see Ramírez-Olivencia et al. 2018, for A-nucleus). The black crosses give the location of the maximum for each frequency. The arrows represent the directions of the shift (black) and the structure (grey).
Current usage metrics show cumulative count of Article Views (full-text article views including HTML views, PDF and ePub downloads, according to the available data) and Abstracts Views on Vision4Press platform.
Data correspond to usage on the plateform after 2015. The current usage metrics is available 48-96 hours after online publication and is updated daily on week days.
Initial download of the metrics may take a while.