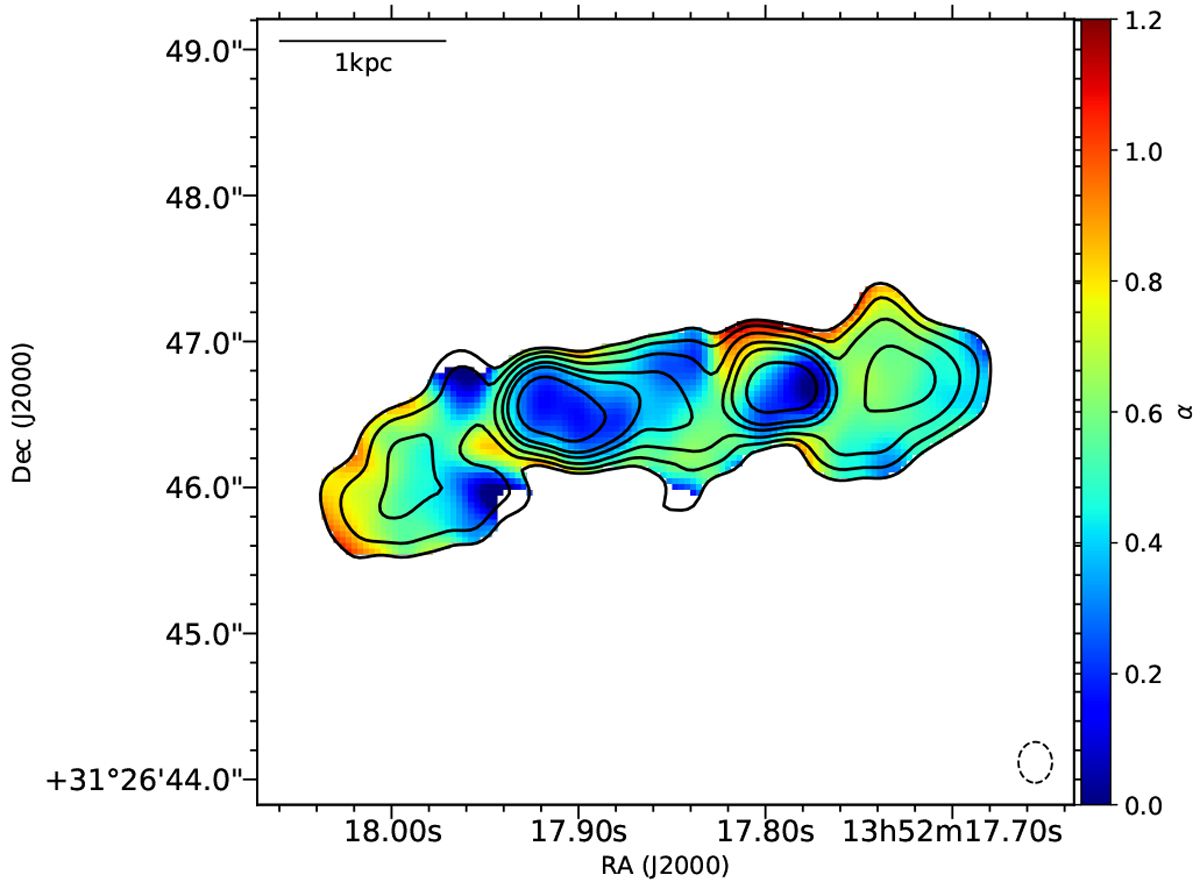
Fig. 5
Download original image
Spectral index map of the high resolution central region of 3C 293 from 144–1360 MHz at 0.28′′ × 0.23′′ resolution. The map is overlaid with 1360 MHz contours with levels at: (5, 10, 20, 40, 65, 150) × σRMS where σRMS = 1.4 mJy beam−1 is the local RMS noise in the smoothed MERLIN image. The inner lobes clearly show a distinct spectral index population from the diffuse emission around them.
Current usage metrics show cumulative count of Article Views (full-text article views including HTML views, PDF and ePub downloads, according to the available data) and Abstracts Views on Vision4Press platform.
Data correspond to usage on the plateform after 2015. The current usage metrics is available 48-96 hours after online publication and is updated daily on week days.
Initial download of the metrics may take a while.