Fig. 4
Download original image
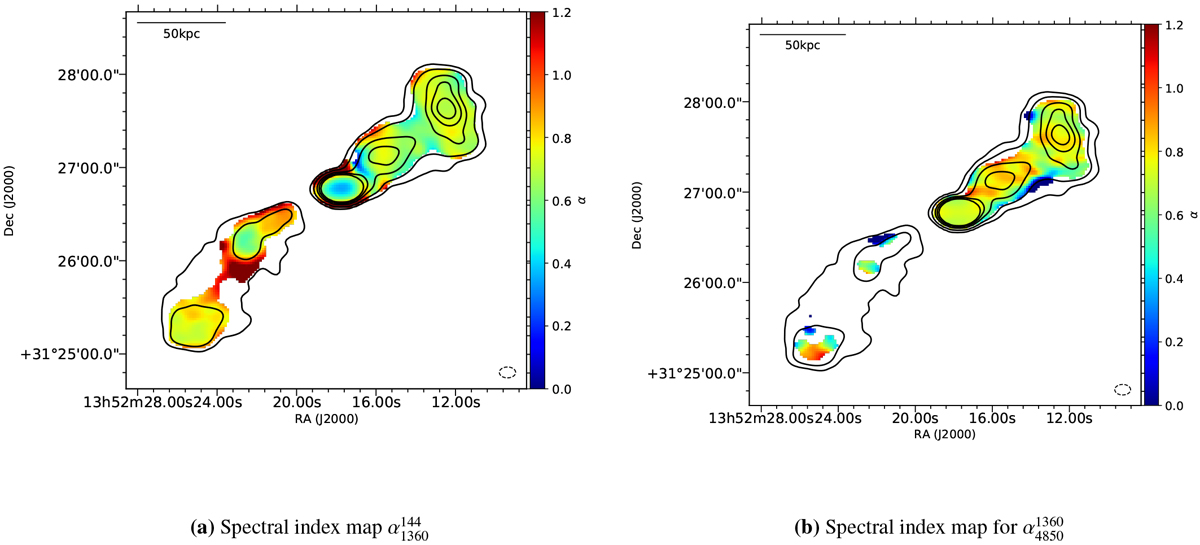
(a) The spectral index map from 144–1360 MHz and (b) 1360–4850 MHz for the large-scale lobes emission of 3C 293. All the maps are overlaid with contours of the 1360 MHz image at 10.5′′ × 7′′ resolution with the contour levels at (5, 30, 150, 350, 700) × σRMS where σRMS = 0.09 mJy beam−1 is the local RMS noise. A flatter spectrum with ![]() < 0.5 can be seen in the centre of the 144–1360 MHz map. The 1360–4850 MHz spectral index map does not include most of the southern lobe, since very little emission from the southern lobe is recovered at 4850 MHz.
< 0.5 can be seen in the centre of the 144–1360 MHz map. The 1360–4850 MHz spectral index map does not include most of the southern lobe, since very little emission from the southern lobe is recovered at 4850 MHz.
Current usage metrics show cumulative count of Article Views (full-text article views including HTML views, PDF and ePub downloads, according to the available data) and Abstracts Views on Vision4Press platform.
Data correspond to usage on the plateform after 2015. The current usage metrics is available 48-96 hours after online publication and is updated daily on week days.
Initial download of the metrics may take a while.