Fig. 3

Download original image
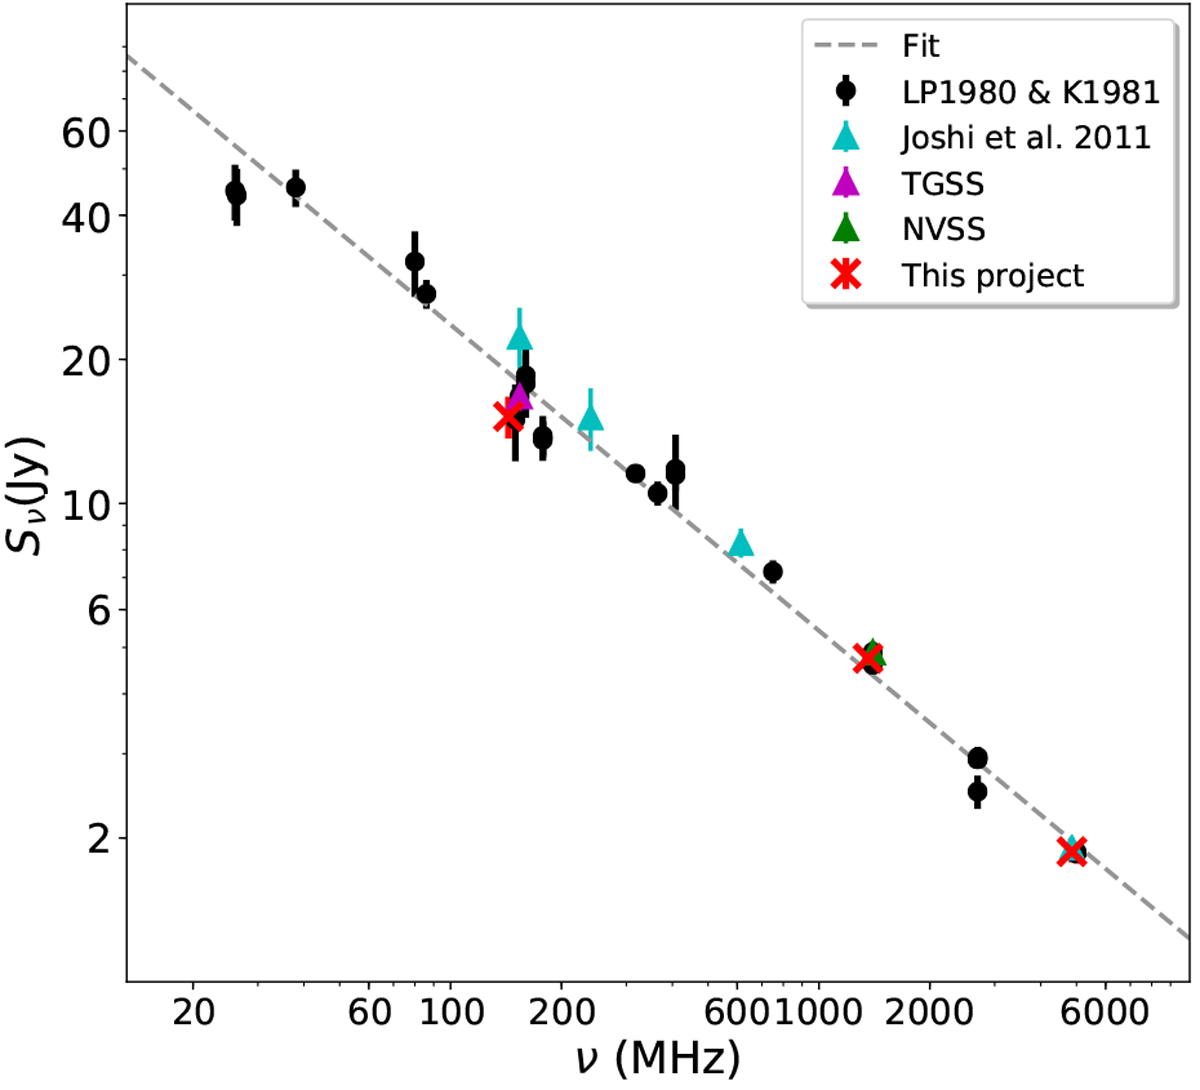
Integrated flux spectrum for 3C 293 from our images and literature. The red crosses are the integrated flux densities measured within the 3σ contours in our images, where σ is the local RMS noise. For the LOFAR HBA point at 144 MHz, only Dutch array data was used. Black circles are values from Laing & Peacock (1980) (LP1980) and Kuehr et al. (1981) (K1981). Cyan, purple and green triangles are values from the Joshi et al. (2011), TGSS (Intema et al. 2017) and NVSS (Condon et al. 1998) respectively. Flux densities from TGSS and this project were set to the Baars et al. (1977) flux scale for consistency. The dashed line shows the straight line fit using the values from literature (including TGSS and NVSS) and has a slope of −0.64 ± 0.01.
Current usage metrics show cumulative count of Article Views (full-text article views including HTML views, PDF and ePub downloads, according to the available data) and Abstracts Views on Vision4Press platform.
Data correspond to usage on the plateform after 2015. The current usage metrics is available 48-96 hours after online publication and is updated daily on week days.
Initial download of the metrics may take a while.


