Fig. 2
Download original image
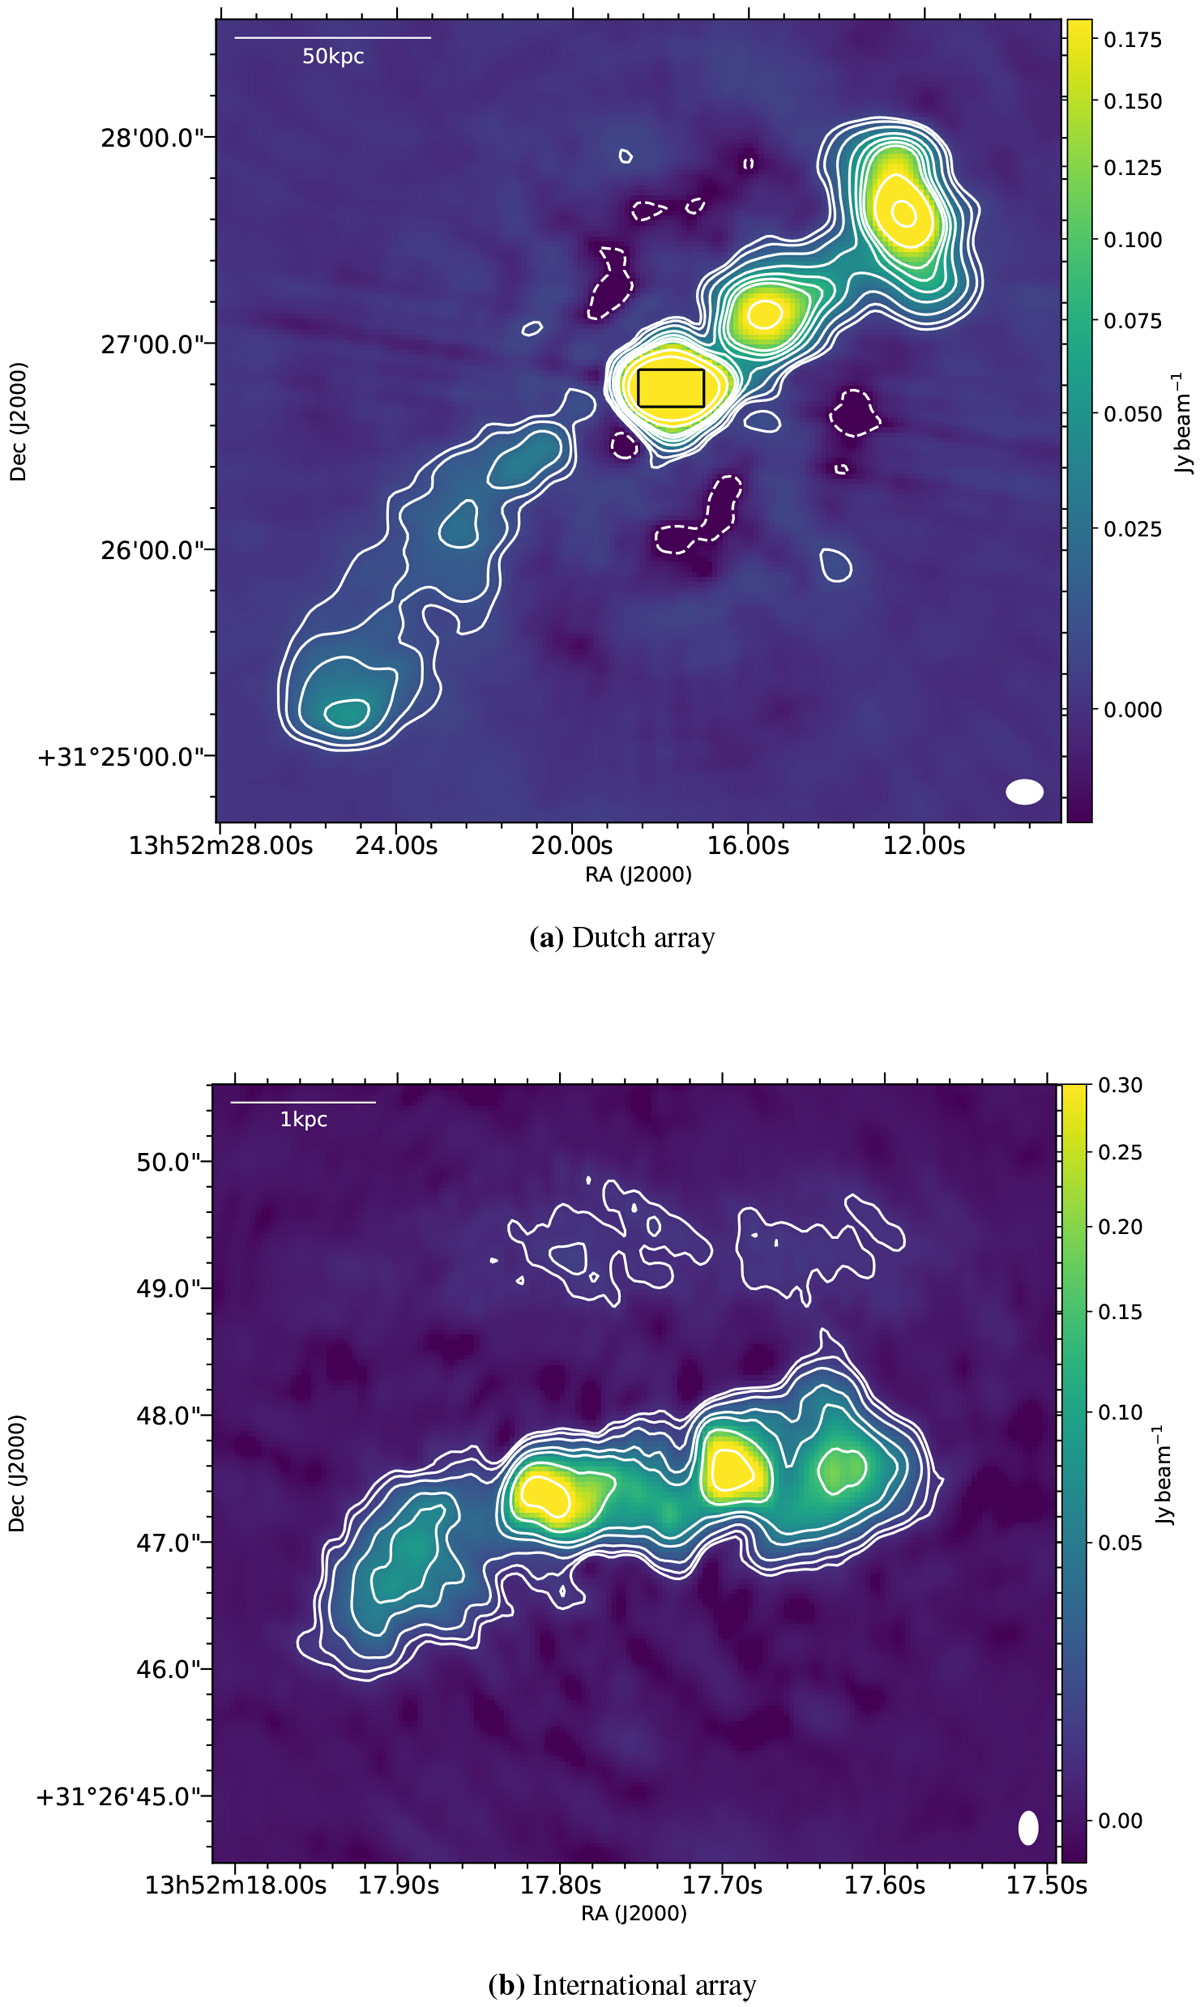
(a) LOFAR HBA image with Dutch array from LoTSS-DR2 data showing the large-scale (~250′′) structure in 3C 293 at 144 MHz with a resolution of 10.5′′ × 7′′. The contours marking the large-scale structure are at: (−3, 3, 5, 10, 20, 30, 40, 50, 100, 200) × σRMS where σRMS = 2 mJy beam−1 is the RMS noise in the image. The black rectangle in the centre marks the region that is shown in the high resolution image. (b) The LOFAR HBA image with international stations at 144 MHz of the central 4.5 kpc region with a resolution of 0.26′′ × 0.15′′. The small-scale inner lobes and diffuse emission are visible and are marked with contours at: (−3, 3, 5, 10, 25, 40, 100, 250) × σRMS where σRMS = 1.5 mJy beam−1 is the RMS noise in the image. Image statistics for all images are summarised in Table 2.
Current usage metrics show cumulative count of Article Views (full-text article views including HTML views, PDF and ePub downloads, according to the available data) and Abstracts Views on Vision4Press platform.
Data correspond to usage on the plateform after 2015. The current usage metrics is available 48-96 hours after online publication and is updated daily on week days.
Initial download of the metrics may take a while.