Fig. 10
Download original image
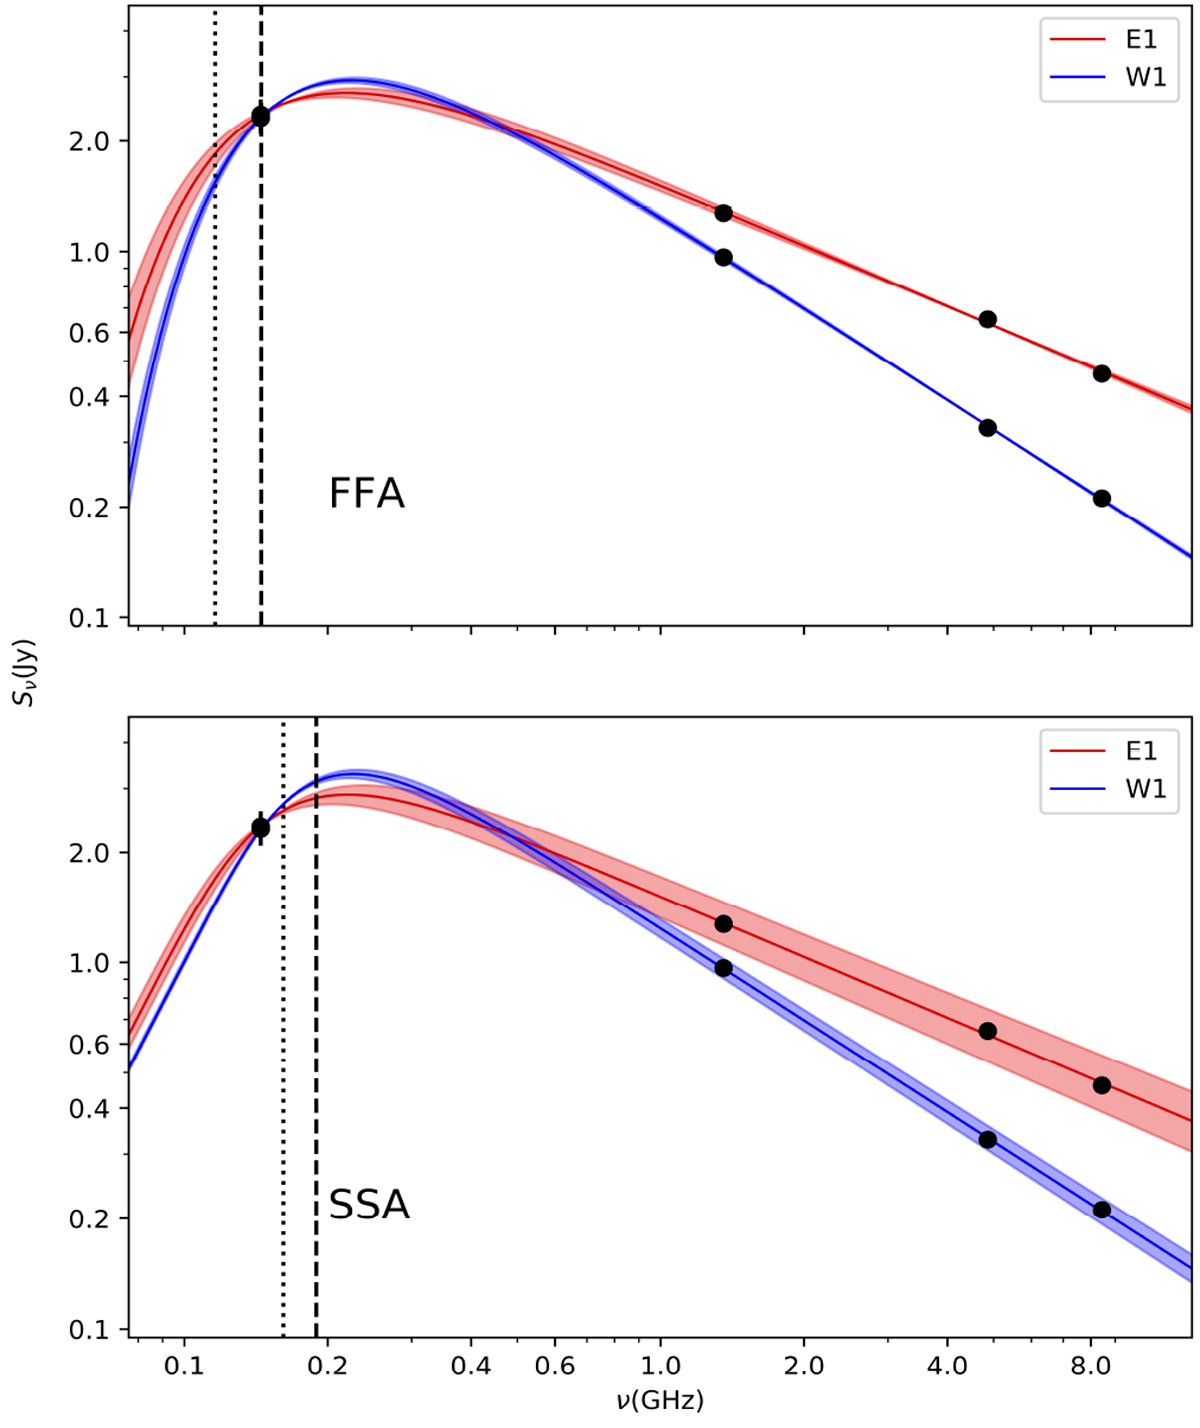
Best fits of Homogeneous FFA (top panel) and SSA (bottom panel) absorption models to the E1 (eastern) and W1 (western) inner lobes regions of 3C 293. A peak in the spectrum can be seen at 220–230MHz. All models provide similar quality fits to the data. The vertical lines show the νp frequency, for E1 (dotted) and W1 (dashed). νp is the frequency at which optical depth τ = 1, an is therefore a measure of the optical depth. From the model fits, νp for W1 is systematically higher than for E1.
Current usage metrics show cumulative count of Article Views (full-text article views including HTML views, PDF and ePub downloads, according to the available data) and Abstracts Views on Vision4Press platform.
Data correspond to usage on the plateform after 2015. The current usage metrics is available 48-96 hours after online publication and is updated daily on week days.
Initial download of the metrics may take a while.