Free Access
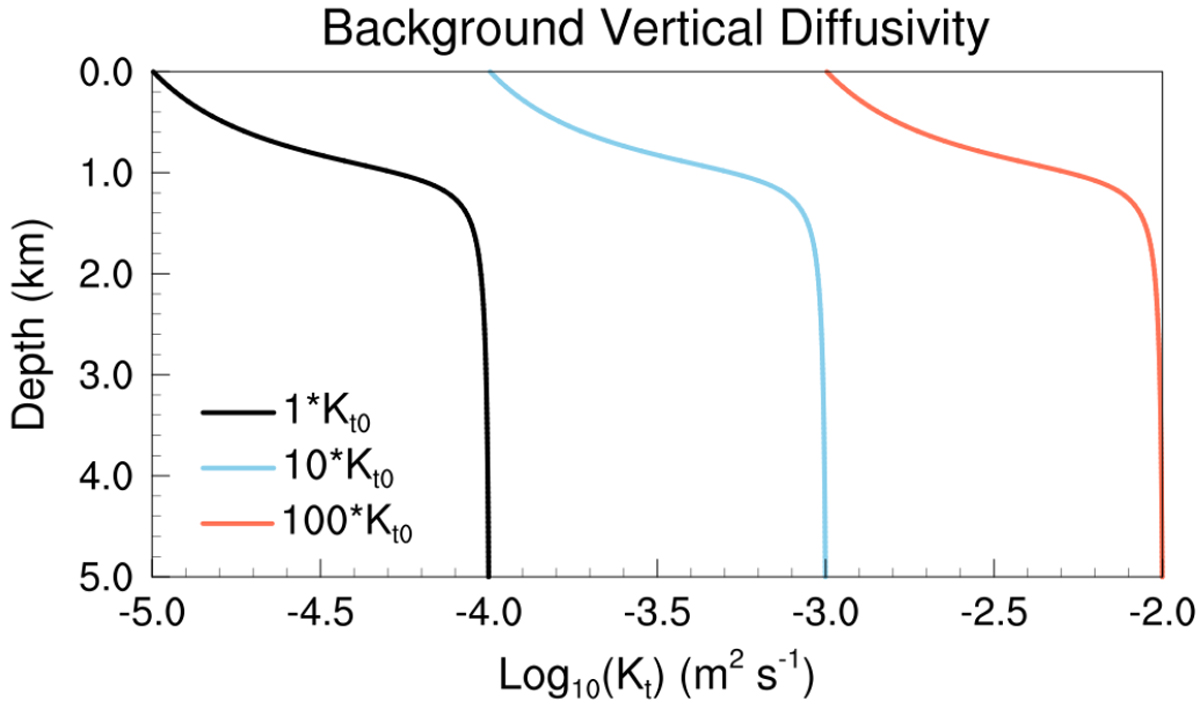
Fig. B.1
Download original image
Profiles of the vertical thermal/salinity diffusivity Kt in the model CCSM3. The black line denotes default diffusivity Kt0, the blue line denotes 10 times the default diffusivity, and the red line denotes 100 times the default diffusivity. The ocean depth is the absolute value of z in Eq. B.1.
Current usage metrics show cumulative count of Article Views (full-text article views including HTML views, PDF and ePub downloads, according to the available data) and Abstracts Views on Vision4Press platform.
Data correspond to usage on the plateform after 2015. The current usage metrics is available 48-96 hours after online publication and is updated daily on week days.
Initial download of the metrics may take a while.