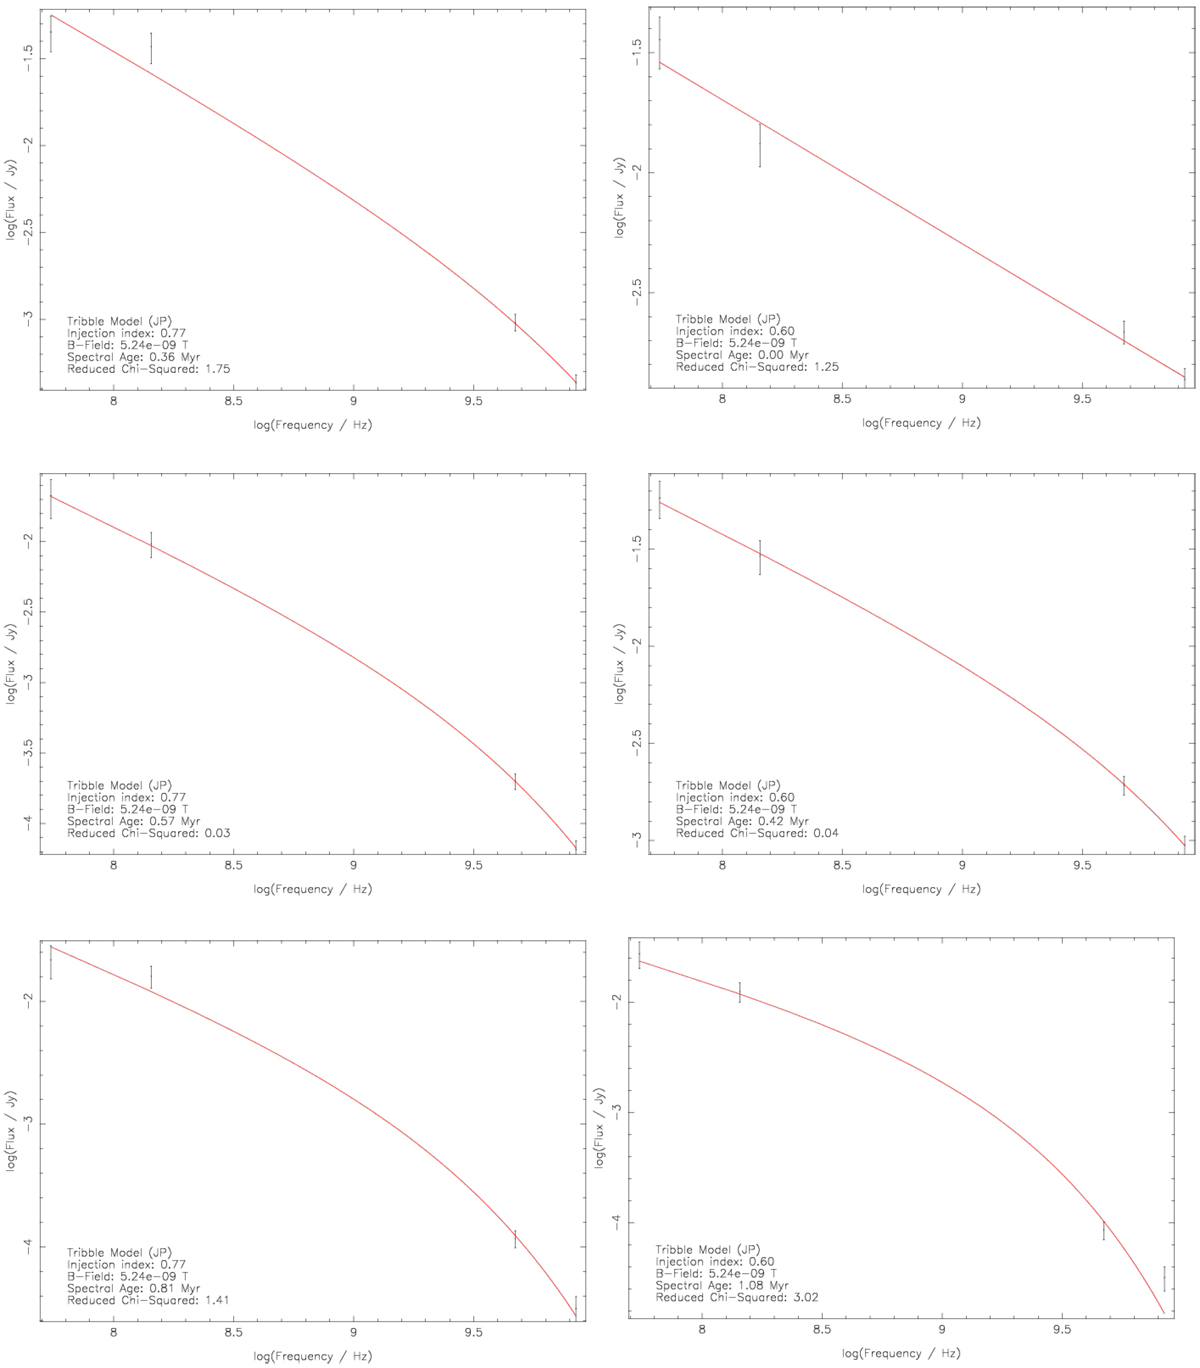
Fig. B.2
Download original image
Model fits of the JP Tribble spectral ageing model for the northern (left) and southern (right) lobes. Fits in a region with the youngest spectral age (top), lowest reduced χ2 (middle), and oldest spectral age (bottom) are shown. The black points with error bars indicate the flux density data pointsin that region and the red line shows the model fit. In the lower left corner of each panel the fitted model, best fitting injection index, magnetic field strength and spectral age in that region, and the reduced χ2 values are listed.
Current usage metrics show cumulative count of Article Views (full-text article views including HTML views, PDF and ePub downloads, according to the available data) and Abstracts Views on Vision4Press platform.
Data correspond to usage on the plateform after 2015. The current usage metrics is available 48-96 hours after online publication and is updated daily on week days.
Initial download of the metrics may take a while.