Fig. B.1
Download original image
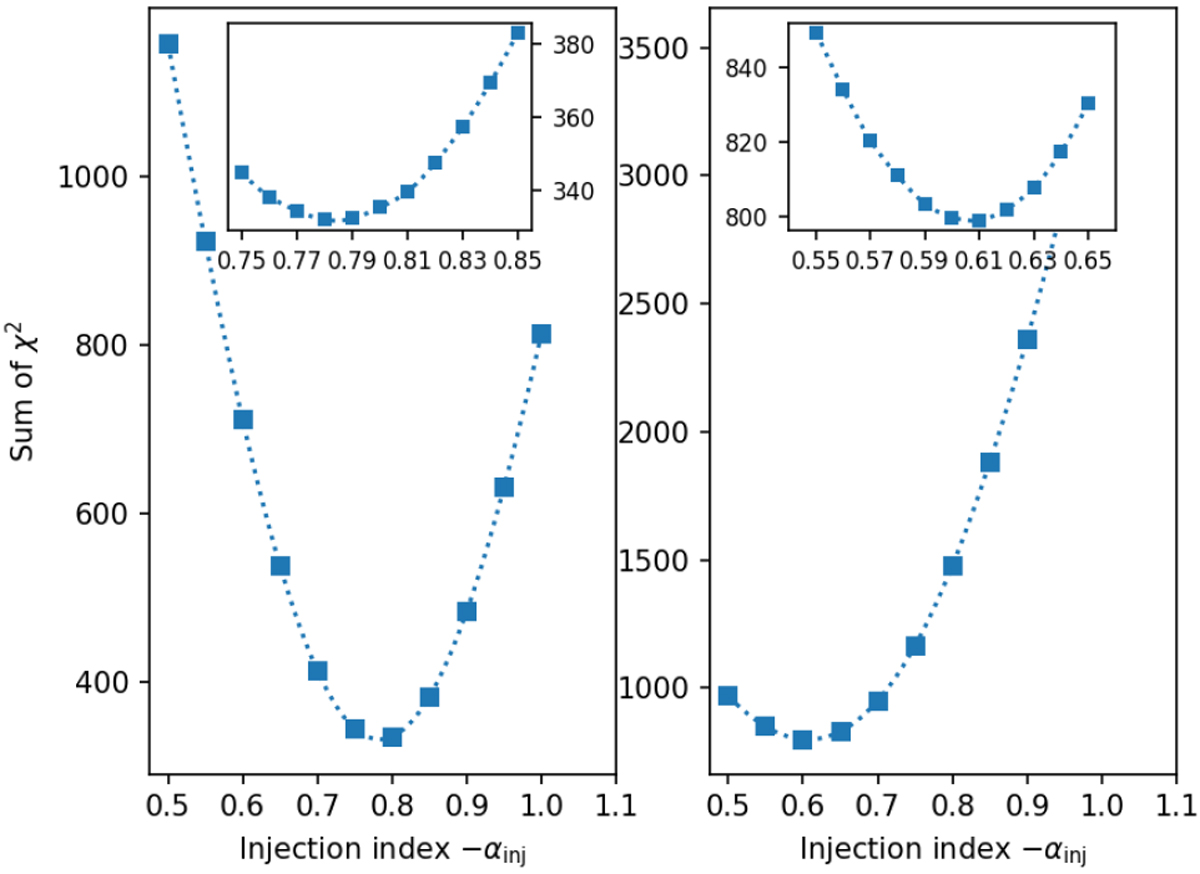
χ2 landscape of the initial broad search for the injection index αinj. Left: Northern lobe. Right: Southern lobe. Squares indicate the explored values. Dotted lines are cubic spline fits for illustrative purposes. The large panels show the χ2 values for the broad search from 0.5 to 1.0. The insets show the χ2 values for the detailed search in a narrower range of 0.75−0.85 (left) and 0.55−0.65 (right).
Current usage metrics show cumulative count of Article Views (full-text article views including HTML views, PDF and ePub downloads, according to the available data) and Abstracts Views on Vision4Press platform.
Data correspond to usage on the plateform after 2015. The current usage metrics is available 48-96 hours after online publication and is updated daily on week days.
Initial download of the metrics may take a while.