Fig. 6
Download original image
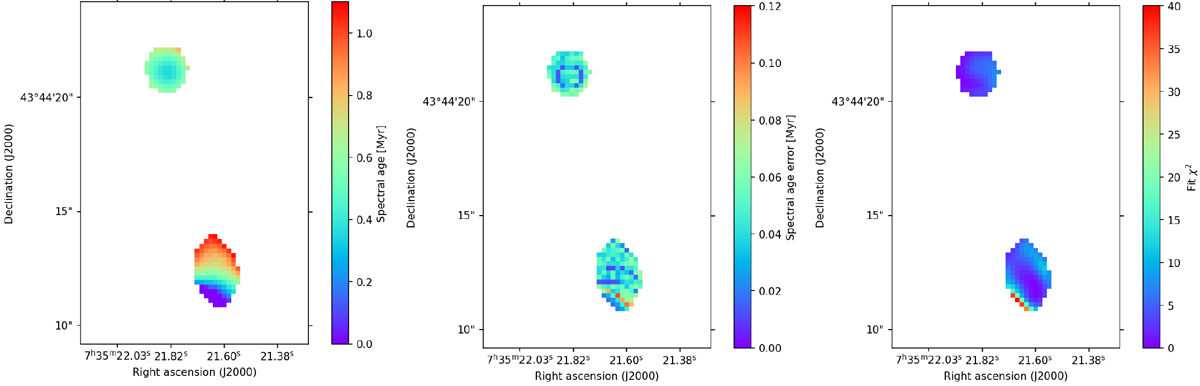
Spectral age maps of the fitted regions in 4C 43.15 after fitting a JP+Tribble model to the LBA, HBA, and VLA data. From left to right: spectral age of the plasma, its positive uncertainty, and the χ2 value of the regions. The maps are shown at a 0.9″ resolution. The grey contours are drawn based on the 4.71 GHz map, starting at 0.29 mJy beam−1. Each contour represents a factor of ![]() increase in intensity.
increase in intensity.
Current usage metrics show cumulative count of Article Views (full-text article views including HTML views, PDF and ePub downloads, according to the available data) and Abstracts Views on Vision4Press platform.
Data correspond to usage on the plateform after 2015. The current usage metrics is available 48-96 hours after online publication and is updated daily on week days.
Initial download of the metrics may take a while.