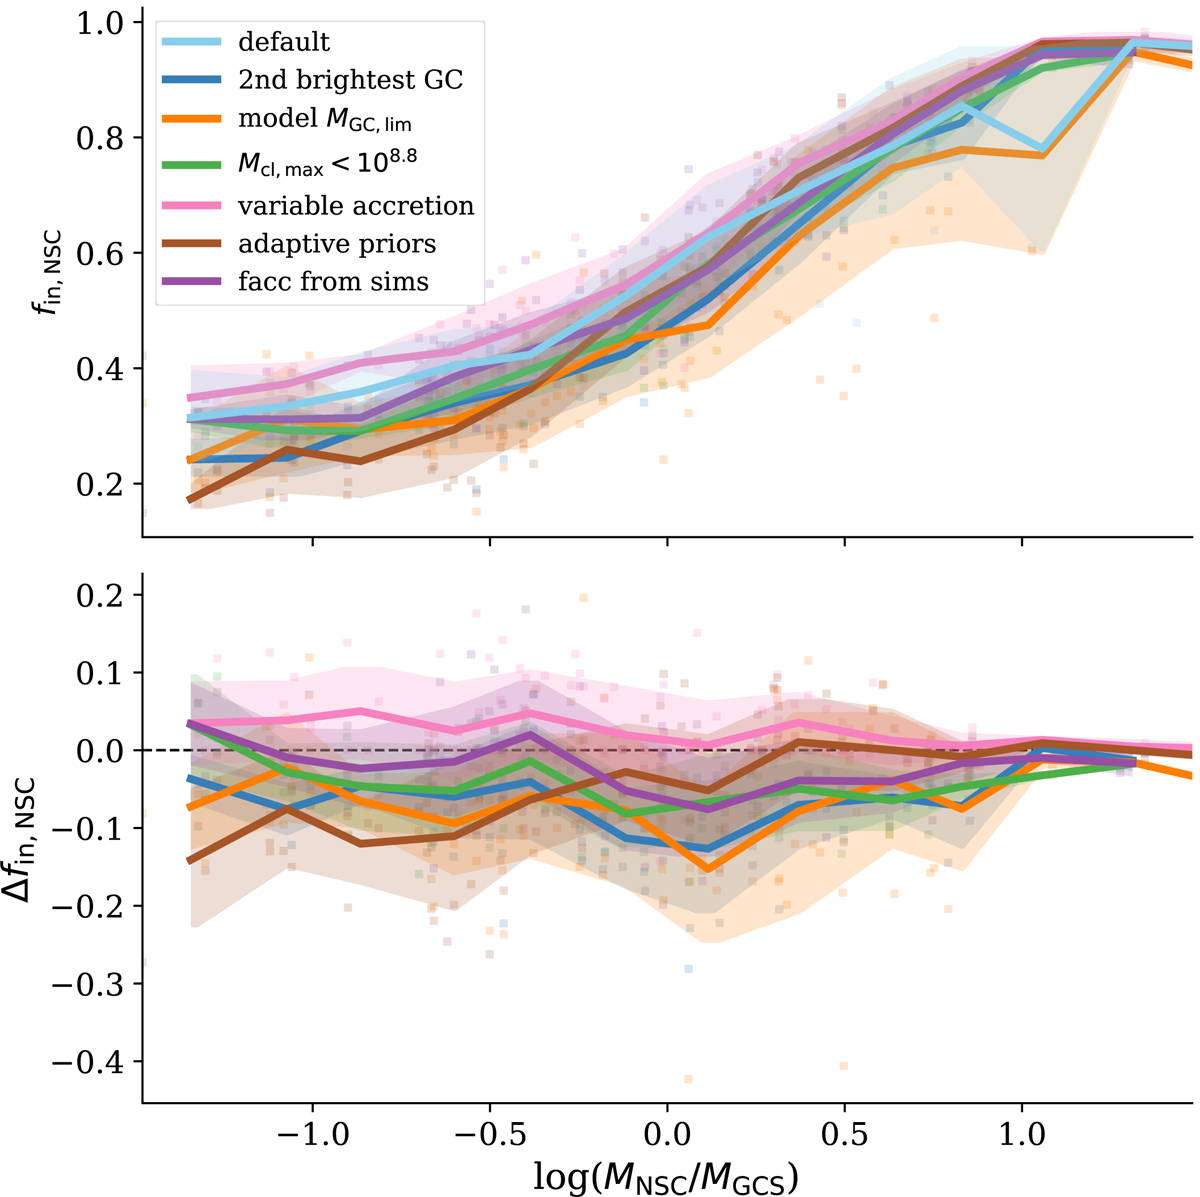
Fig. 5.
Download original image
Influence of model settings on the predicted in situ NSC mass fractions. Top: fin, NSC in relation with the ratio of NSC and GCS mass for the different settings. Coloured lines show median-binned data with 1σ scatter for visualisation. Bottom: differential in situ mass fraction relative to the default model. The different settings are summarised in Table 3.
Current usage metrics show cumulative count of Article Views (full-text article views including HTML views, PDF and ePub downloads, according to the available data) and Abstracts Views on Vision4Press platform.
Data correspond to usage on the plateform after 2015. The current usage metrics is available 48-96 hours after online publication and is updated daily on week days.
Initial download of the metrics may take a while.