Free Access
Fig. 4.
Download original image
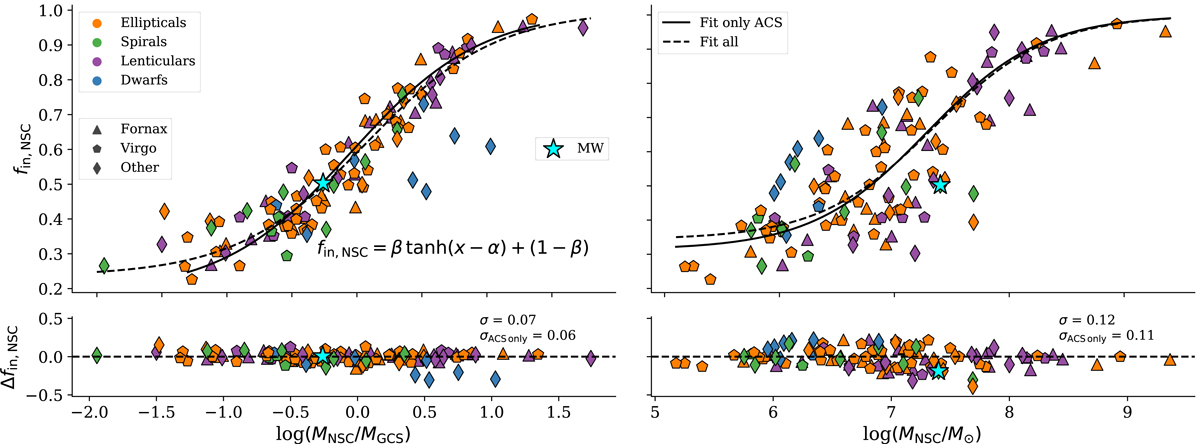
In situ mass fraction fin, NSC versus log(MNSC/MGCS) (left) and MNSC (right) as seen in Fig. 3. The solid line shows the fit using only the ACS data (Fornax and Virgo galaxies), and the dashed line when using all data. Bottom panels: residual scatter. The standard deviations are shown in the label.
Current usage metrics show cumulative count of Article Views (full-text article views including HTML views, PDF and ePub downloads, according to the available data) and Abstracts Views on Vision4Press platform.
Data correspond to usage on the plateform after 2015. The current usage metrics is available 48-96 hours after online publication and is updated daily on week days.
Initial download of the metrics may take a while.