Fig. 9
Download original image
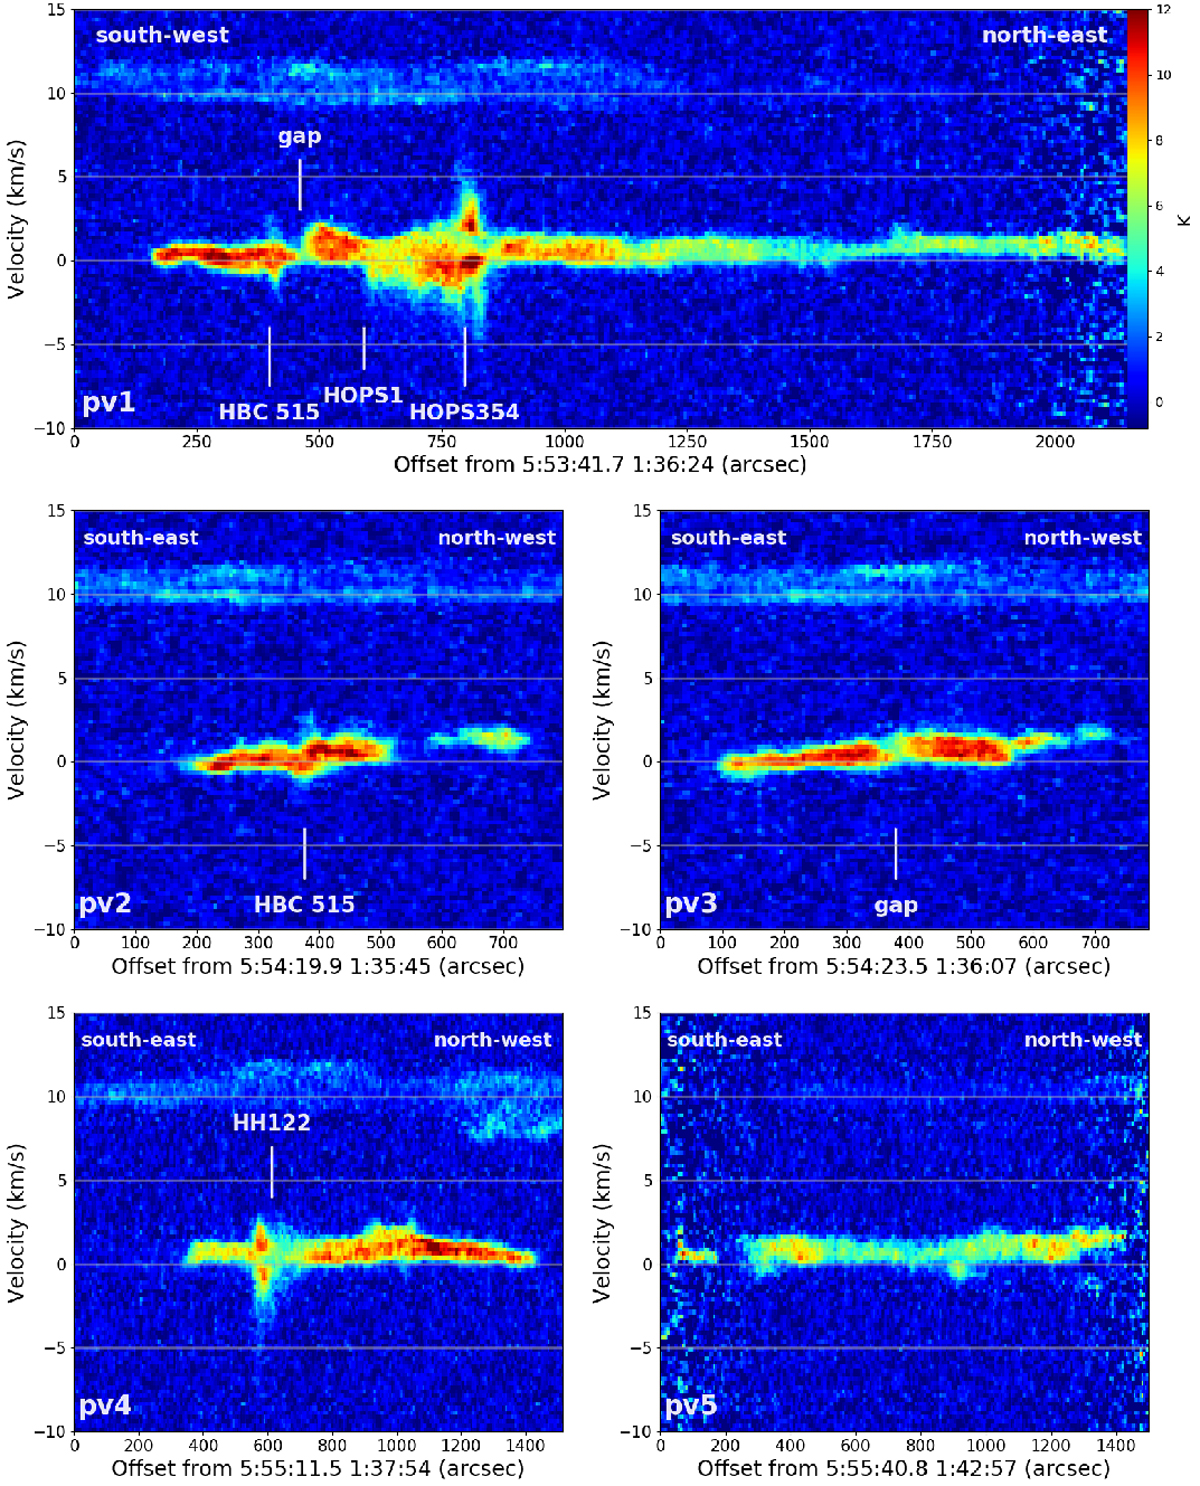
Position-velocity cuts across L 1622, as marked in Fig. 8. Top: cut along the clouds major axis, starting from 5h53m41.s7, 1°36′24′′ to the south-west of the cloud, ending at 5h55m36.s3, 1°57′37′′ in the north-eastern corner of the mapped area. Middle row: cuts along the minor axis of the cloud; left panel (pv2): starting at 5h 54m19.s9, 1°35′45′′ (south-west), ending at 5h53m44s, 1°45′29′′ (north-east); right panel (pv3): starting at 5h54m23.s5, 1°36′07′′ (south-west), ending at 5h54m23.s5, 1°36′07′′ (north-east). Bottom row: cuts along the minor axis of the cloud, further east in the tail of the cloud; left panel (pv4): starting at 5h 55m11.s5, 1°37′54′′ (south-west), ending at 5h53m54.s2, 1°54′02′′ (north-east); right panel (pv5): starting at 5h53m54.s2 1°54′02′′ (south-west), ending at 5h53m54.s2 1°54′02′′ (north-east).
Current usage metrics show cumulative count of Article Views (full-text article views including HTML views, PDF and ePub downloads, according to the available data) and Abstracts Views on Vision4Press platform.
Data correspond to usage on the plateform after 2015. The current usage metrics is available 48-96 hours after online publication and is updated daily on week days.
Initial download of the metrics may take a while.