Fig. 8
Download original image
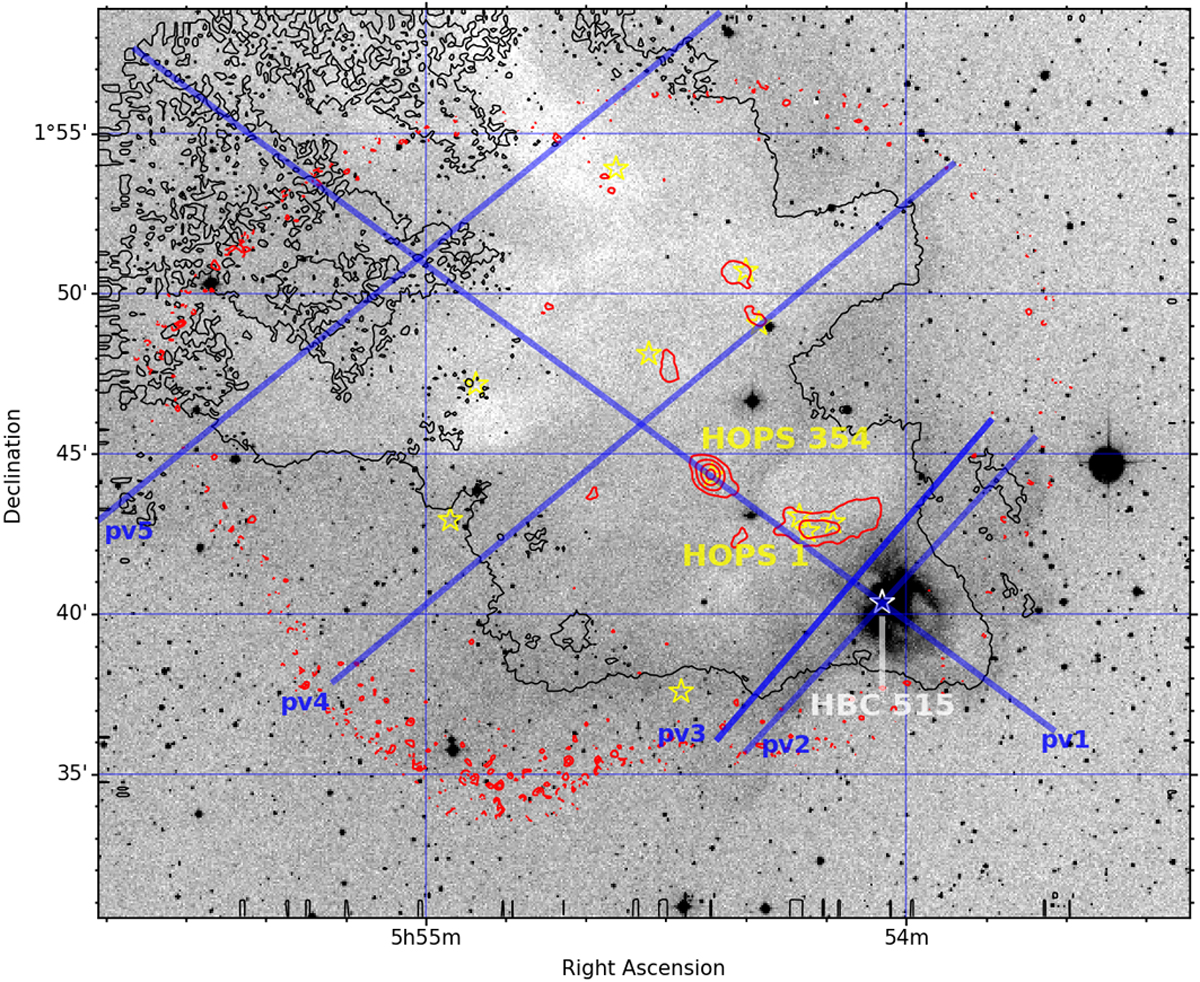
Overview of the L 1622 field. The greyscale shows an optical (DSS2 blue) image. Black and red contour overlays mark the extent of the CO(3–2) emission of the 1km s−1 component and APEX Laboca 870 μm dust continuum emission, respectively. Yellow stars mark the location of HOPS protostars, while the white star marks the positionof the HBC 515 pre-main-sequence multiple system. Blue lines mark the location of the position-velocity cuts shown in Fig. 9.
Current usage metrics show cumulative count of Article Views (full-text article views including HTML views, PDF and ePub downloads, according to the available data) and Abstracts Views on Vision4Press platform.
Data correspond to usage on the plateform after 2015. The current usage metrics is available 48-96 hours after online publication and is updated daily on week days.
Initial download of the metrics may take a while.