Fig. C.1
Download original image
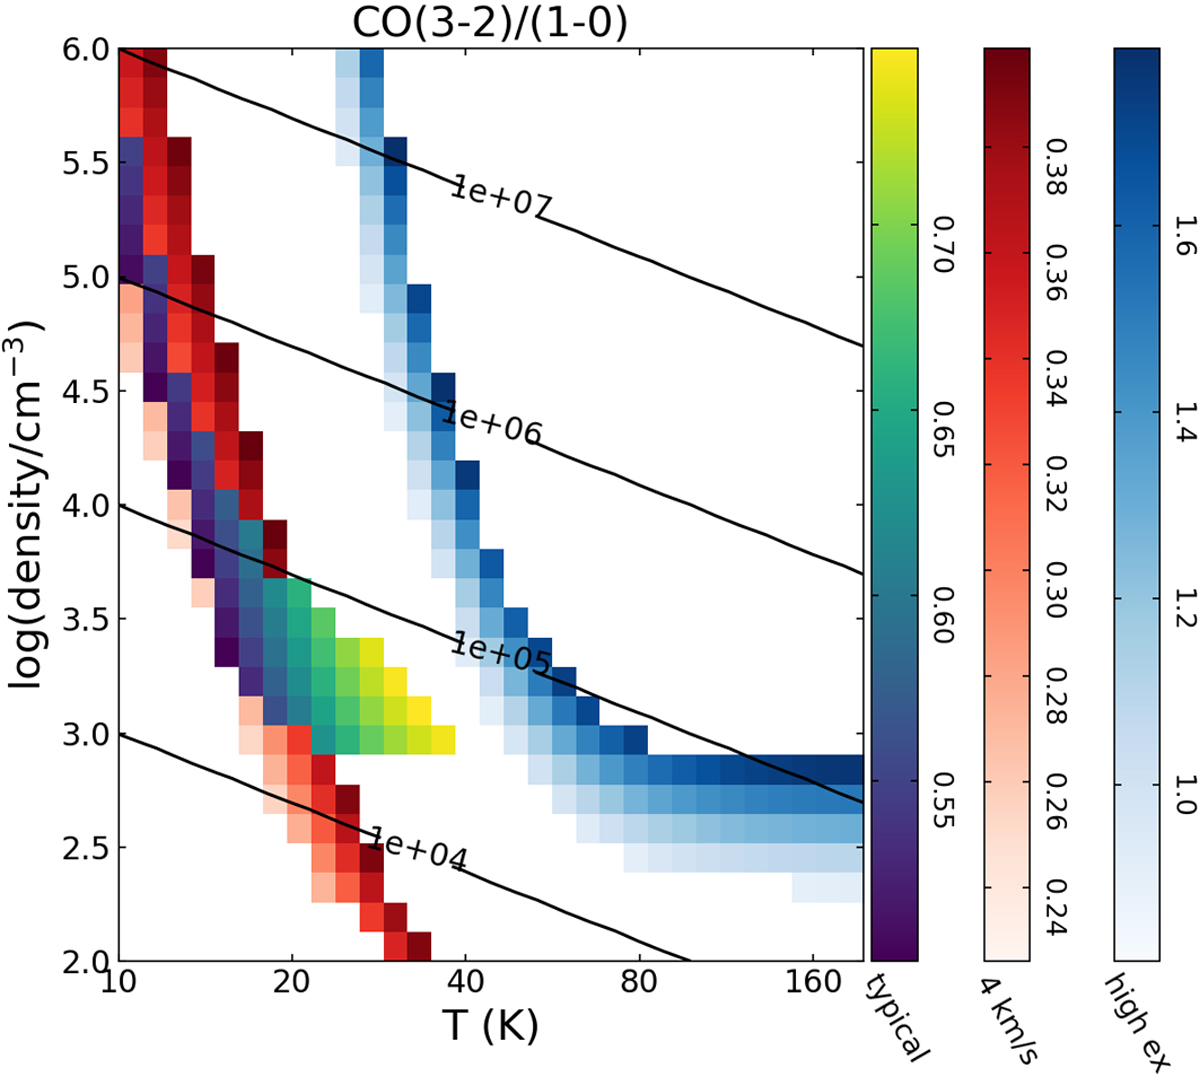
Parameter space of RADEX models reproducing the line in- tensities and line ratios found in the NGC 2023 & NGC 2024 region, for three diverse emission components. Line ratios of models reproducing the ’typical’ emission are shown on a multi-colour scale, models corresponding to the emission component seen at ~4 km/s are shown on a red colour scale, and models reproducing the high-excitation component at the western cloud edge are shown on a blue colour scale. For each component, models for a column density in the (logarithmic) middle of the column density range reproducing the respective characteristic line ratios and intensities are shown: N = 1018 cm−2 (typical emission), N = 2 ⋅ 1017 cm−2 (4 km/s component), and N = 1016 cm−2 (high-excitation component). Straight lines mark locations of constant pressure p = n ⋅ T. Top: RADEX models for the ’typical’ emission.
Current usage metrics show cumulative count of Article Views (full-text article views including HTML views, PDF and ePub downloads, according to the available data) and Abstracts Views on Vision4Press platform.
Data correspond to usage on the plateform after 2015. The current usage metrics is available 48-96 hours after online publication and is updated daily on week days.
Initial download of the metrics may take a while.