Fig. B.2
Download original image
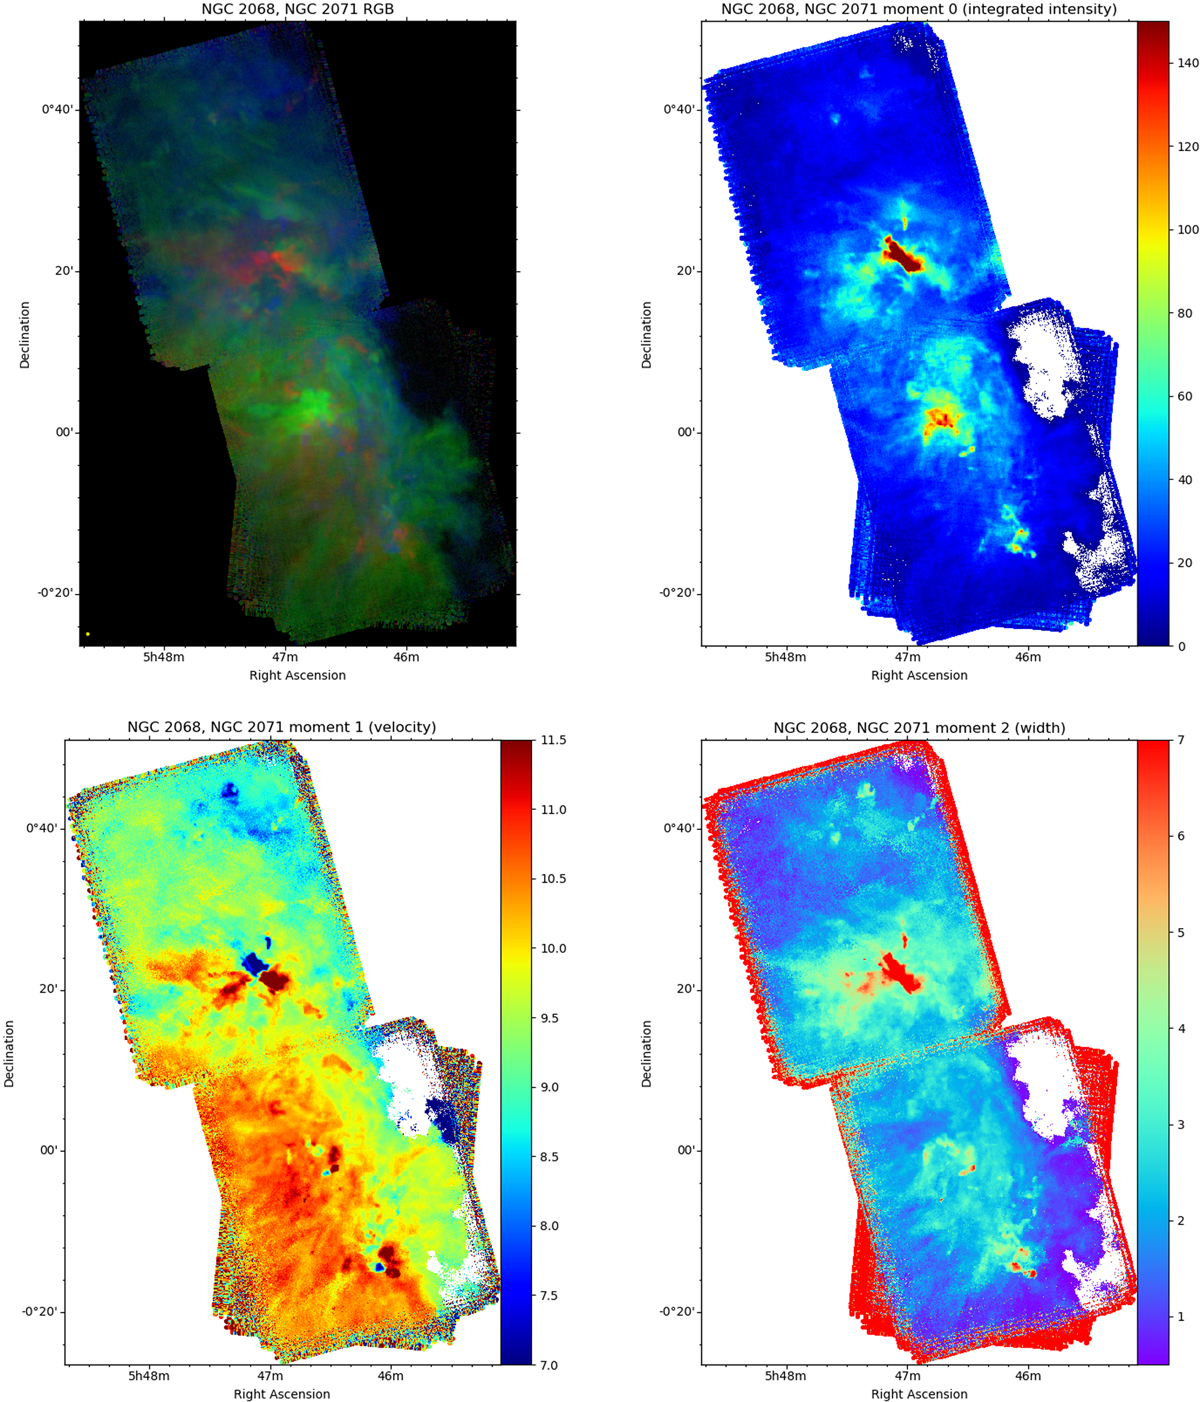
Properties of the velocity field in the NGC 2068 & NGC 2071 area. Top, left panel: red-green-blue representation of the velocity field around the clouds ambient velocity; red: v = +11.25 km/s to + 13.0 km/s; green: v = +9.5 km/s to + 11.0 km/s; blue: v = +7.5 km/s to + 9.25 km/s. The yellow dot in the lower left corner indicates the beam size. The remaining three panels show maps of the first three moments of the line emission, computed over the velocity range from 0 km/s to +20 km/s, and limited to emission brighter than 3.5 K.
Current usage metrics show cumulative count of Article Views (full-text article views including HTML views, PDF and ePub downloads, according to the available data) and Abstracts Views on Vision4Press platform.
Data correspond to usage on the plateform after 2015. The current usage metrics is available 48-96 hours after online publication and is updated daily on week days.
Initial download of the metrics may take a while.