Fig. 4
Download original image
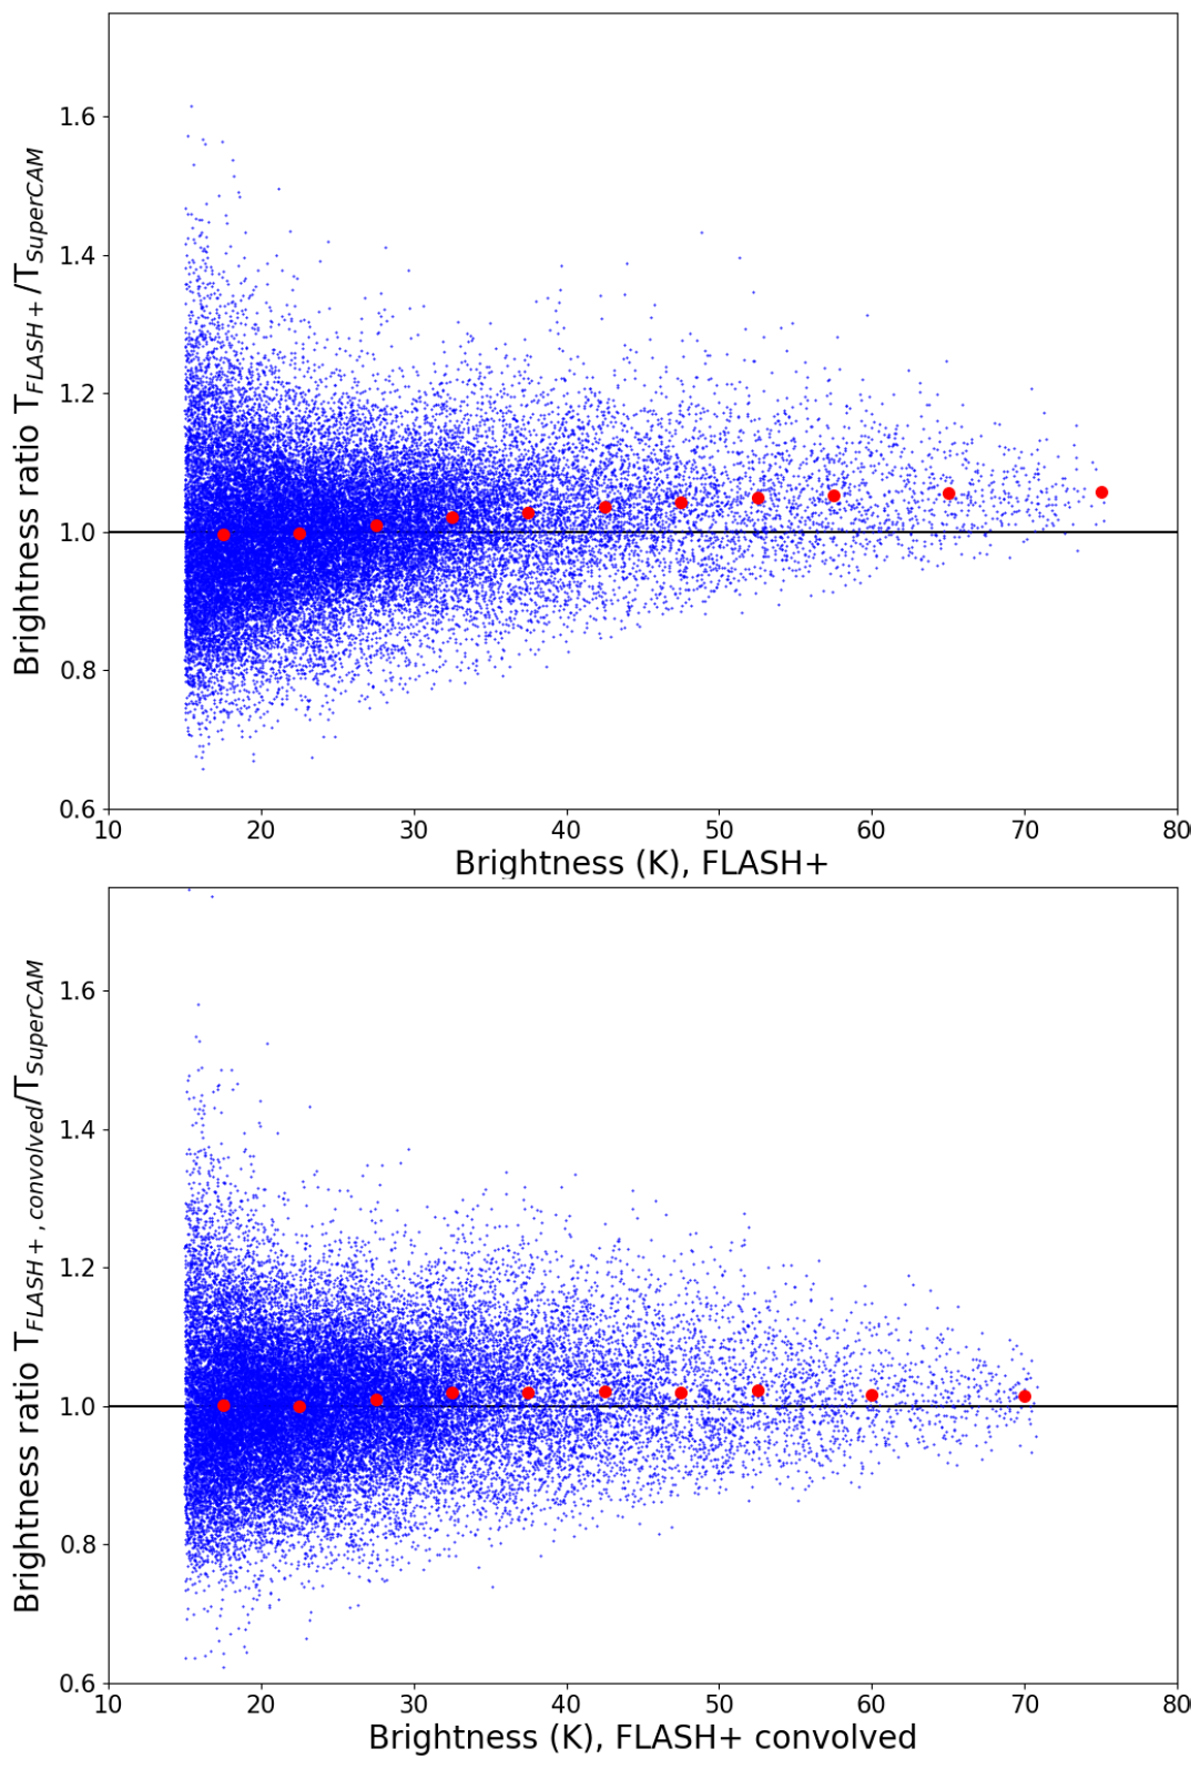
Per pixel flux ratios (blue dots) of the Sandell et al. (2015) FLASH+ CO(3–2) NGC 2023 data to the ALCOHOLS SuperCAM data, as a function of the brightness of the FLASH+ data, for pixels with a FLASH+ brightness greater than 15 K. Red bullets represent flux ratios averaged over 5 K temperature bins (10 K bins for the two rightmost points). Top: direct ratio of the FLASH+ and SuperCAM data; bottom: ratio after convolving the FLASH+ data with a 9′′ Gaussian.
Current usage metrics show cumulative count of Article Views (full-text article views including HTML views, PDF and ePub downloads, according to the available data) and Abstracts Views on Vision4Press platform.
Data correspond to usage on the plateform after 2015. The current usage metrics is available 48-96 hours after online publication and is updated daily on week days.
Initial download of the metrics may take a while.