Fig. 3
Download original image
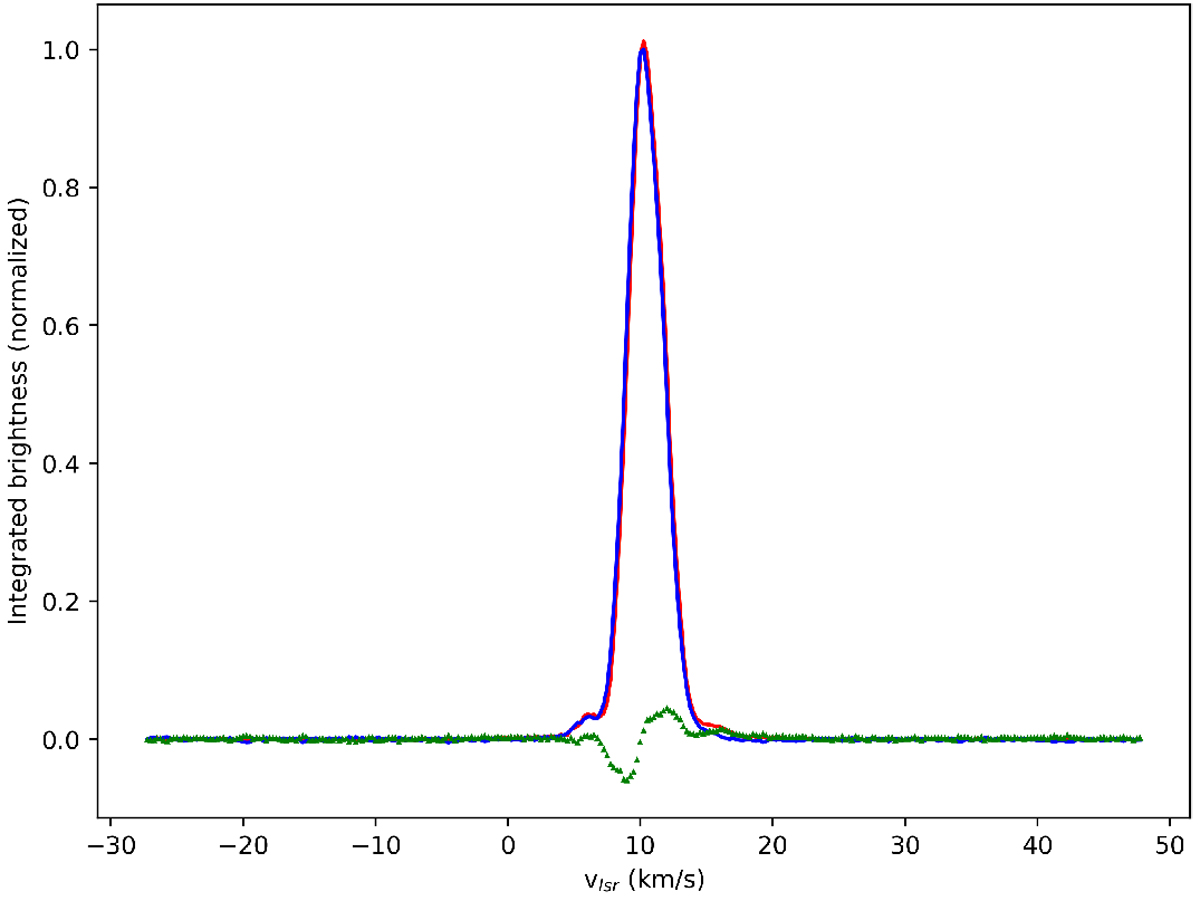
Comparison between the integrated (per channel) brightness of the FLASH+ CO(3–2) observations of NGC 2023 by Sandell et al. (2015) (red line) and the ALCOHOLS dataset (blue line). The green triangles show the difference between thetwo datasets. The data were normalized to give a peak integrated brightness of 1.0 for the ALCOHOLS dataset.
Current usage metrics show cumulative count of Article Views (full-text article views including HTML views, PDF and ePub downloads, according to the available data) and Abstracts Views on Vision4Press platform.
Data correspond to usage on the plateform after 2015. The current usage metrics is available 48-96 hours after online publication and is updated daily on week days.
Initial download of the metrics may take a while.