Fig. 27
Download original image
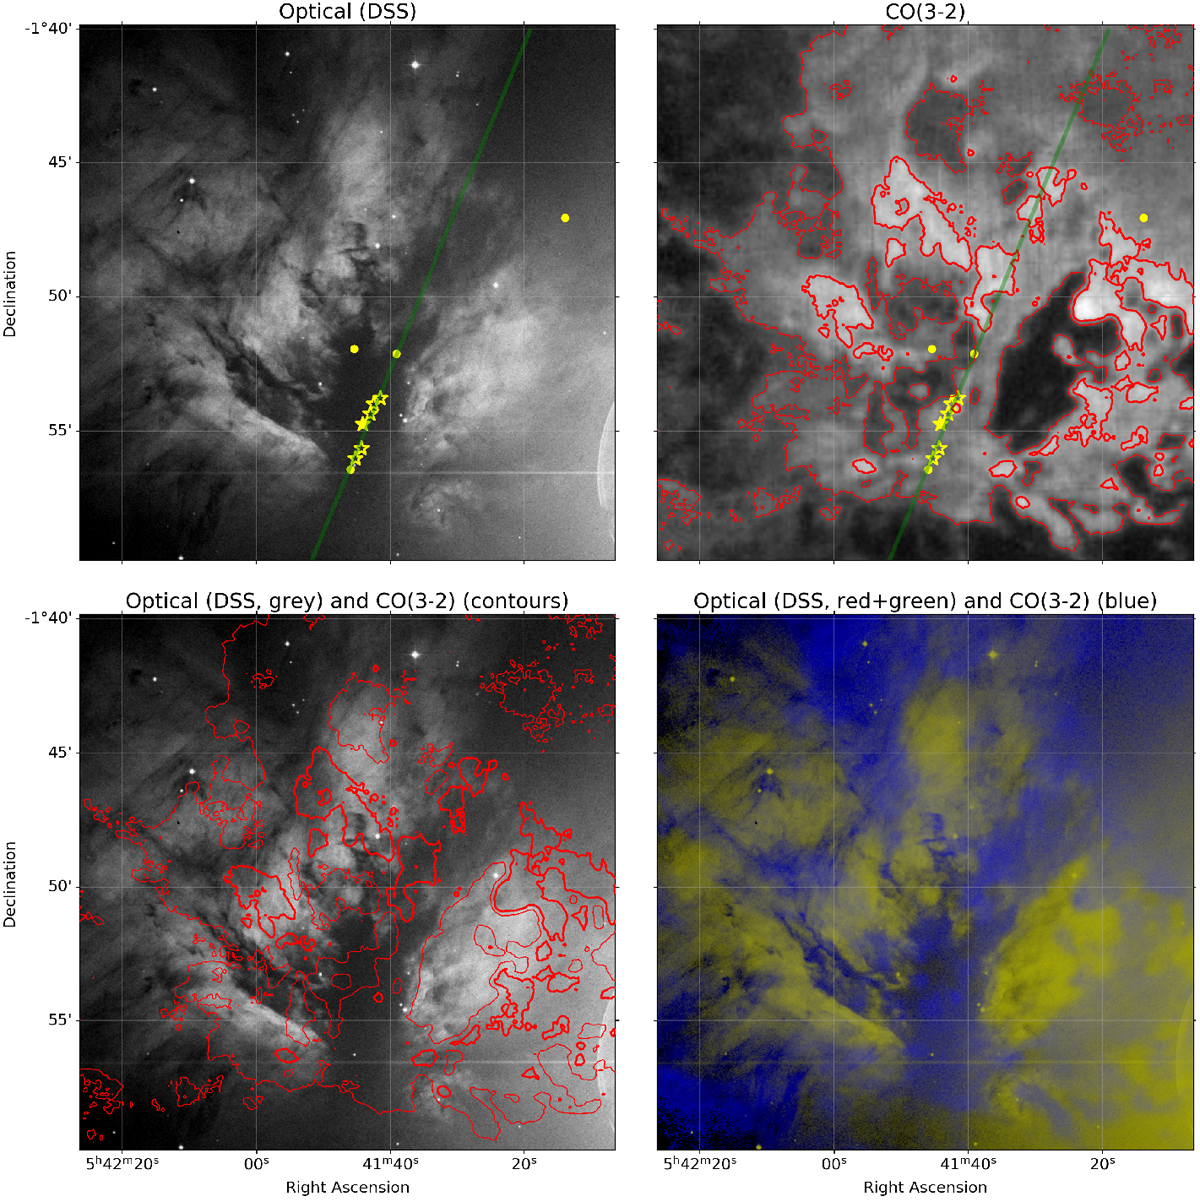
Comparison of the NGC 2024 H II region at optical wavelengths and CO(3–2) emission at 8 km s−1. The panel to the top left shows a DSS2-blue image; yellow stars mark the location of the sub-millimetre cores FIR1 to FIR6 (counting from north to south; Mezger et al. 1988), yellow dots mark HOPS protostars in the field, the green line marks the location of the position-velocity cut shown in Fig. 25. The panel to the top right shows the CO(3–2) emission in a single velocity channel at 8 km s−1 (greyscale and contours). The bottom left panel shows an overlay of the CO(3–2) 8 km s−1 velocity channel (using the same contour levels as in the upper right panel) on the DSS2-blue image, the bottom right panel shows a colour-composite image, where the optical DSS2-blue image is shown in the red and green channels, and CO at 8 km s−1 in the blue channel.
Current usage metrics show cumulative count of Article Views (full-text article views including HTML views, PDF and ePub downloads, according to the available data) and Abstracts Views on Vision4Press platform.
Data correspond to usage on the plateform after 2015. The current usage metrics is available 48-96 hours after online publication and is updated daily on week days.
Initial download of the metrics may take a while.