Fig. 23
Download original image
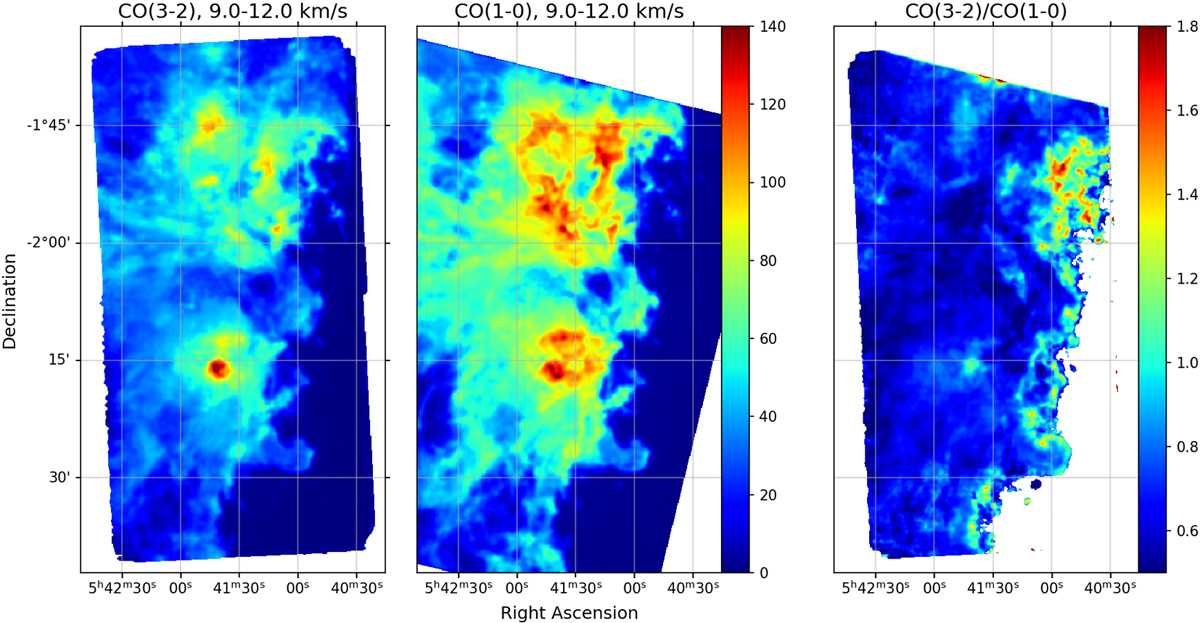
CO(3–2) map over the NGC 2023 & NGC 2024 survey field, integrated over the same velocity range (9–12 km s−1) and convolved to the same 31′′ beam as in Fig. 2 of Pety et al. (2017), along with their CO(1–0) velocity integrated map, and the ratio of the CO(3–2)/CO(1–0) maps (where the ratio was computed for all pixels with a CO(3–2) line brightness temperature greater than 2 K, i.e. excluding pixels with noisy ratios due to low signal-to-noise ratios).
Current usage metrics show cumulative count of Article Views (full-text article views including HTML views, PDF and ePub downloads, according to the available data) and Abstracts Views on Vision4Press platform.
Data correspond to usage on the plateform after 2015. The current usage metrics is available 48-96 hours after online publication and is updated daily on week days.
Initial download of the metrics may take a while.