Fig. 14
Download original image
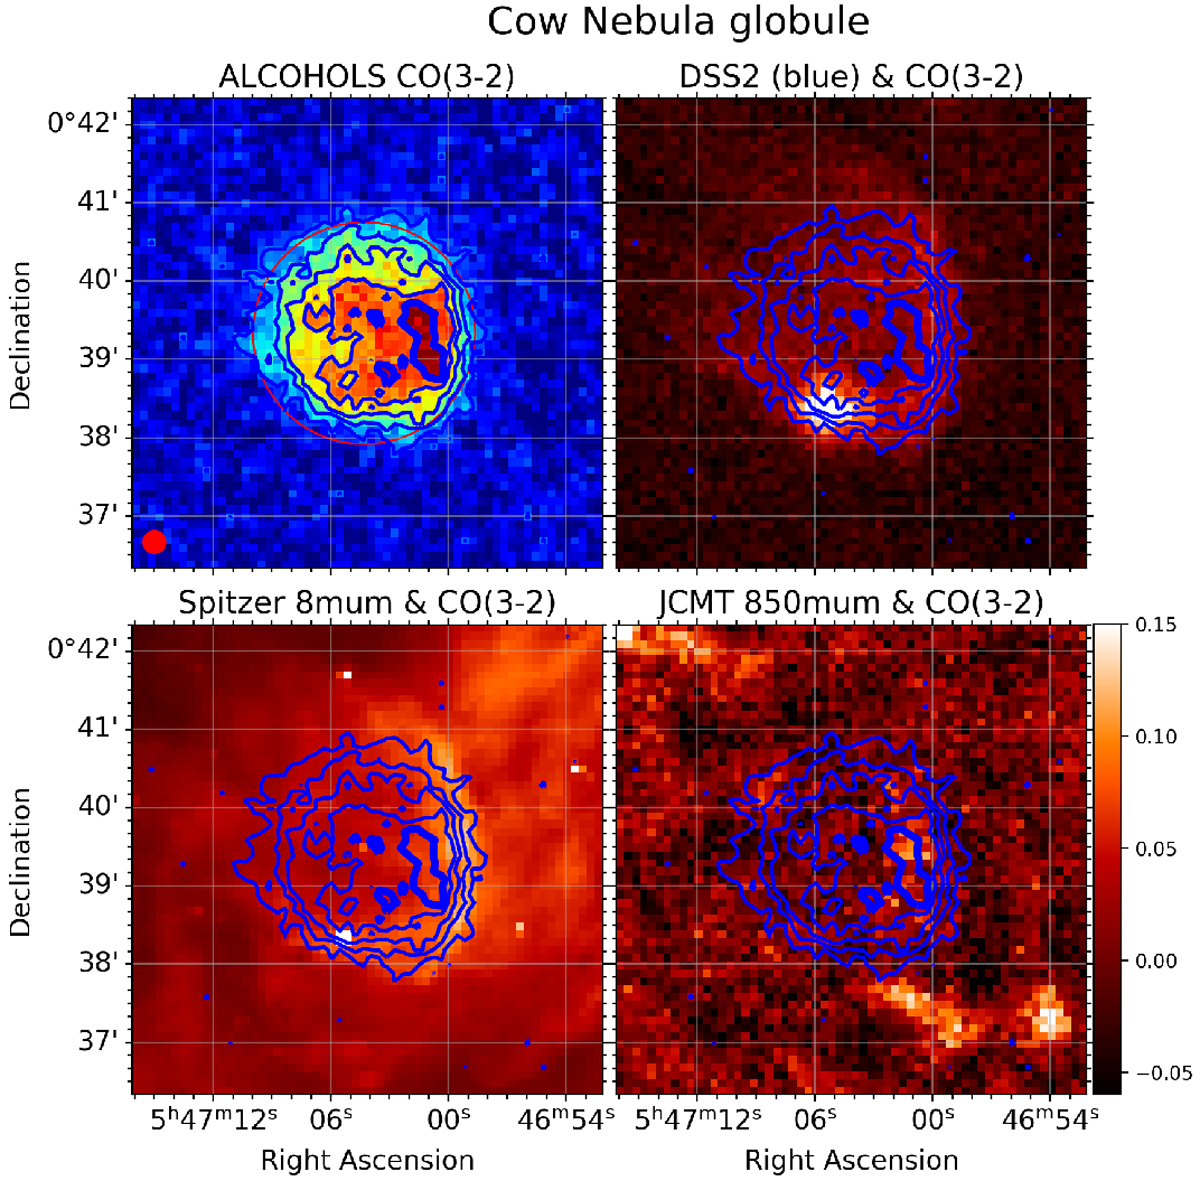
CO emission from the Cow Nebula globule. Top left: emission integrated over the velocity interval v = −6.25 km s−1 to − 4.5 km s−1. The circle is centred at 5h47m04.s3, +00°39′20′′ and serves to illustrate the circular morphology of the globule. Top right, bottom left, bottom right: integrated CO (top left panel) overlaid as contours over an optical image of the region (DSS2, blue), a Spitzer 8 μm image (Megeath et al. 2012), and a JCMT 850 μm map (Kirk et al. 2016), respectively.
Current usage metrics show cumulative count of Article Views (full-text article views including HTML views, PDF and ePub downloads, according to the available data) and Abstracts Views on Vision4Press platform.
Data correspond to usage on the plateform after 2015. The current usage metrics is available 48-96 hours after online publication and is updated daily on week days.
Initial download of the metrics may take a while.